Observability tools are crucial to the success of most IT infrastructures and services. This software allows users to quickly track key metrics across all services and applications. By peering into key network metrics, these tools give users detailed real-time data about a system.
The Top 7 Observability Tools in 2024
- SolarWinds Observability Self-Hosted (formerly known as Hybrid Cloud Observability) (Free Trial)
- Datadog
- Dynatrace
- Logic Monitor
- Splunk
- ServiceNow
- New Relic
Observability platforms provide real-time insights, analytics, and intelligence about a system by aggregating data from multiple sources. They parse through network infrastructure, databases, services, and more to give developers a comprehensive overview of the system they’re dealing with. In this post, you’ll discover seven of the best observability solutions in 2024, their advantages, and why you should consider integrating them into your monitoring process.
1. SolarWinds Observability Self-Hosted (formerly known as Hybrid Cloud Observability) (Free Trial)
© SolarWinds Worldwide, LLC. All rights reserved.
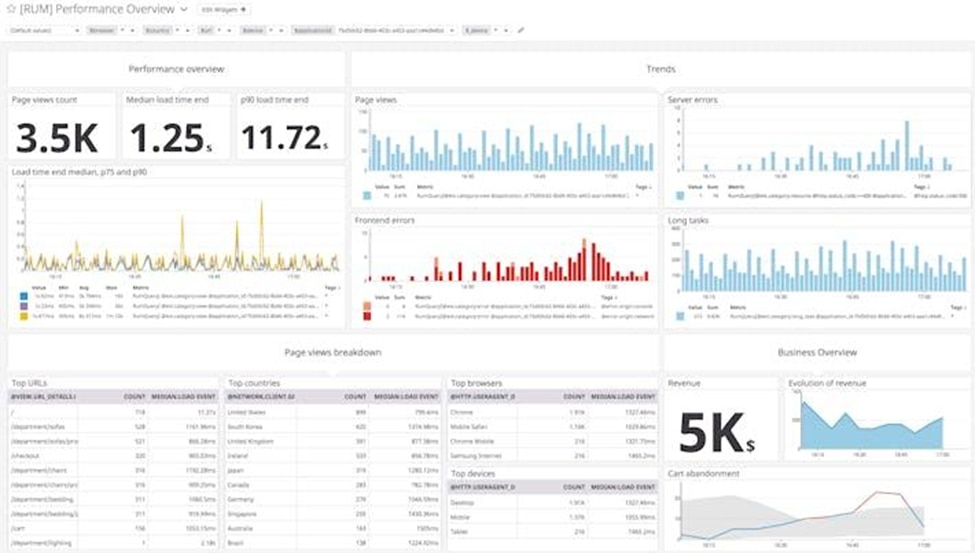
As SolarWinds states on its website, “SolarWinds Observability Self-Hosted (formerly known as Hybrid Cloud Observability) is designed to help organizations ensure availability and reduce remediation time across on-premises and multi-cloud environments by increasing visibility, intelligence, and productivity.” This tool’s strongest feature is its ease of use.
SolarWinds prides itself on having a state-of-the-art, full-stack observability platform that’s simple to start with and flexible enough to expand as you grow. Additionally, SolarWinds Observability Self-Hosted (formerly known as Hybrid Cloud Observability) provides industry-standard monitoring, allowing users to compare data before and after events to see how performance has been impacted over time.
Some of SolarWinds’ key features are listed below:
- Network performance monitoring and insights: SolarWinds Observability Self-Hosted (formerly known as Hybrid Cloud Observability) offers network monitoring, configuration, and traffic analysis. Amplify network management and troubleshooting.
- Easy troubleshooting: The AppStack™ dashboard makes troubleshooting and resolving issues much easier and faster. Users can quickly decipher the cause of issues across server environments and display the status of connected applications and infrastructure.
- End-to-end visibility: SolarWinds allows you to gain productivity and flexibility. It tracks and displays performance metrics across on-prem and hybrid environments.
Learn more Download Free Trial
2. Datadog
© Datadog 2024
Datadog is a top cloud monitoring service that provides granular insights and real-time analysis into application performance. With it, organizations can make informed decisions using its extensive list of monitoring features. With over 700 built-in automations, Datadog allows users to track metrics across systems, apps, and services. It has automation tools, monitoring and instrumentation, source control and bug tracking, and more. Datadog also lets you quickly parse through and analyze your logs for troubleshooting purposes. The platform automatically collects log data and organizes logs, metrics, and trace requests so you can easily navigate between them.
A key feature of Datadog is that it allows multiple users within a team to edit, share, and discuss changes within the software. Datadog allows devs to see which members of the team made changes and what exactly those changes were. They can then communicate individually or as a group right from the app.
Other Datadog features include the following:
- Full-stack visibility: Datadog lets you see across the application stack.
- Logging and log data analysis: Advanced logging and analysis make it easy to troubleshoot problems.
- Collaboration: Datadog allows multiple team members to share info and work on projects from their platform.
3. Dynatrace
© Dynatrace LLC. All rights reserved.
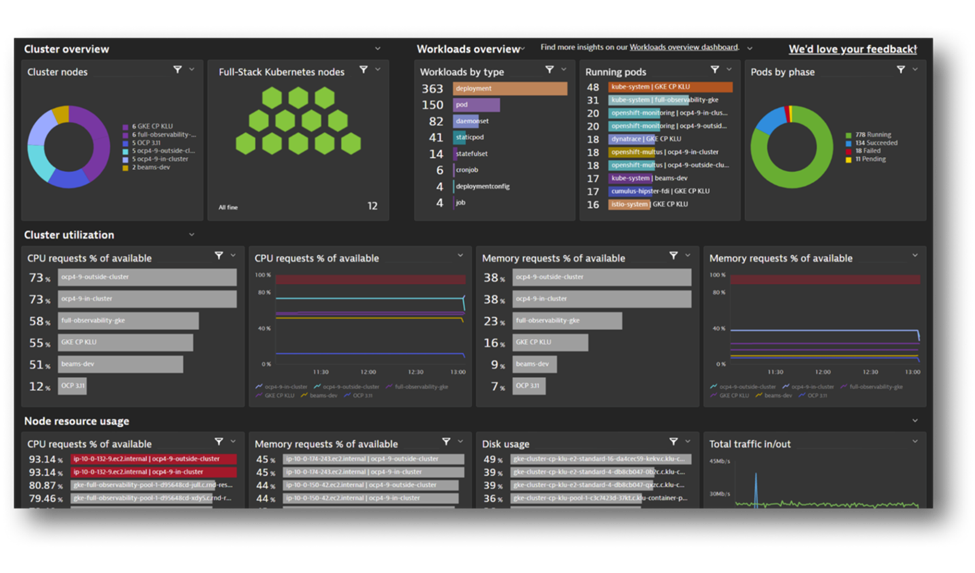
Dynatrace is a cloud-based observability and security tool powered by AI. Like the others on the list, it provides full-stack monitoring and visibility. It’s easily scalable, built for collaboration, and powered by AI. According to Dynatrace, their AI “continuously looks for issues and provides precise root causes, so a resolution can happen in minutes before they become expensive problems.”
Here are some features of Dynatrace:
- End-to-end visibility: The app provides front-end and back-end visibility across hundreds of applications and microservices on the platform.
- AI-powered analytics: Using AI, Dynatrace can automatically analyze logs and pinpoint the root cause of several errors.
- Live monitoring: With Dynatrace, users can monitor the health of IT infrastructure in real time.
- Automatic problem detection: With its top-notch AI, Dynatrace is capable of automatically detecting problems and alerting programmers.
4. Logic Monitor
© Copyright 2024 LogicMonitor Inc.
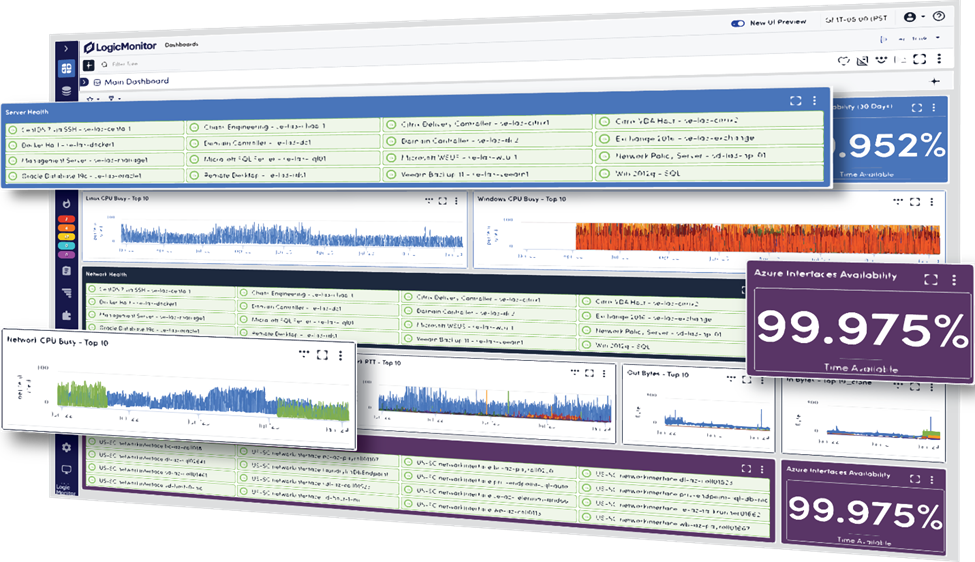
Logic Monitor is a unified hybrid observability platform powered by AI. It gives real-time insights and provides automation for both infrastructure monitoring and cloud monitoring. It’s easy to use, with over 2,000 monitoring integrations. The software automates several IT processes, making workflows much faster. Logic Monitor’s IT process automation consists of Robot Process Automation, machine learning, and artificial intelligence, which constantly updates to add user value. Logic Monitor comes with a two-week free trial for those who want to get a feel for the program.
Features of Logic Monitor include the following:
- Cloud- and server-based monitoring: Being a hybrid observability platform means that Logic Monitor can review and analyze the health of both cloud-based infrastructure and server-based infrastructure.
- IT process automation: Logic Monitor prides itself on its IT process automation, saving development teams time by optimizing workflow using AI.
5. Splunk
© 2005-2024 Splunk INC. All rights reserved.
Splunk is another unified observability solution. It’s designed to give visibility into several modern applications in real time and provides automatic monitoring, troubleshooting, and event alerts in the case of malfunctions. Splunk aggregates and analyzes metrics, traces, and logs from various sources, including infrastructure, applications, and services, to provide insights into system performance, dependencies, and behavior.
In 2019, Splunk acquired the SaaS-based monitoring and analytics platform SignalFX. According to Splunk, the acquisition “adds real-time observability for cloud-native technologies such as microservices, serverless functions, and container orchestrated environments like Docker and Kubernetes.”
Features of Splunk are listed below:
- Log management: The platform creates logs from several sources, making it very easy to troubleshoot issues and gain insights.
- Automatic monitoring: Splunk automatically monitors your system health to save you time and energy.
- Dashboard visualizations: The app creates easy-to-digest charts and visualizations.
- Automatic alerts: With Splunk, you’re automatically notified about important system events.
6. ServiceNow
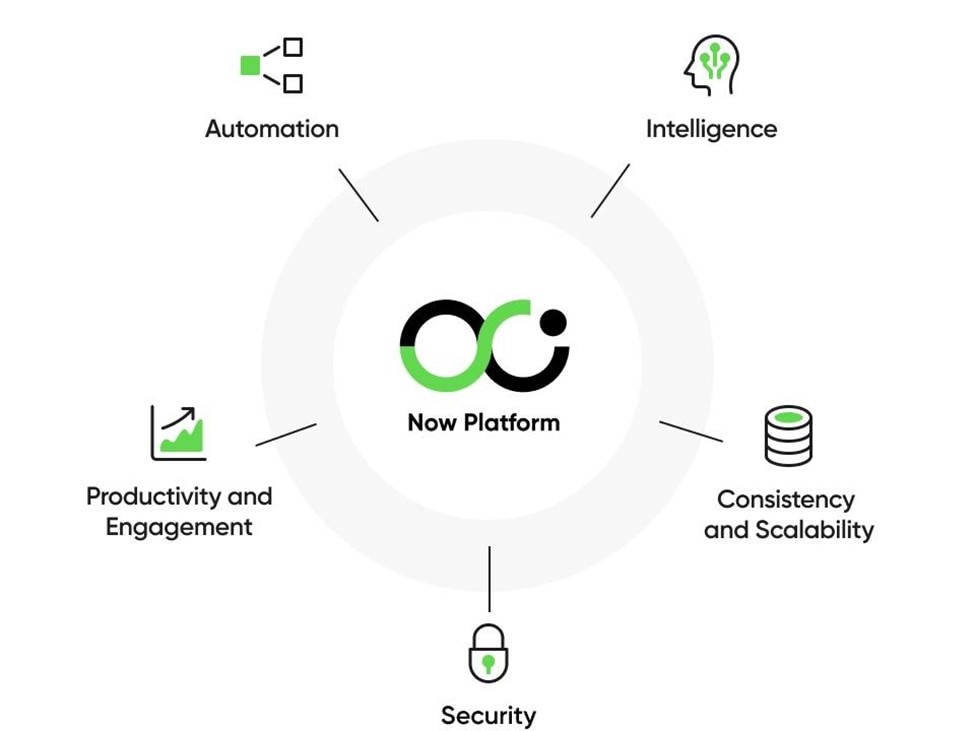
© 2024 ServiceNow. All rights reserved.
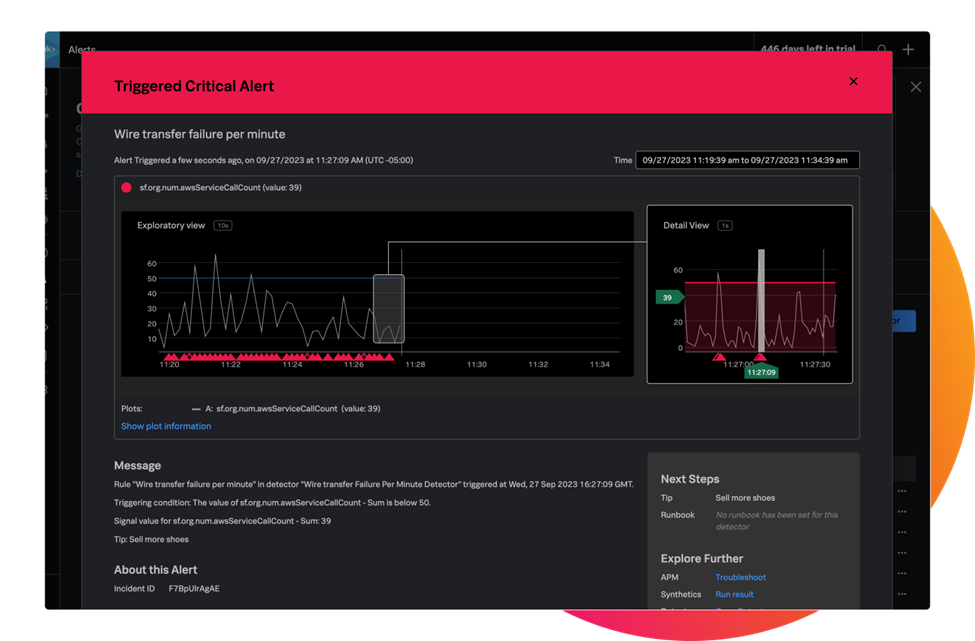
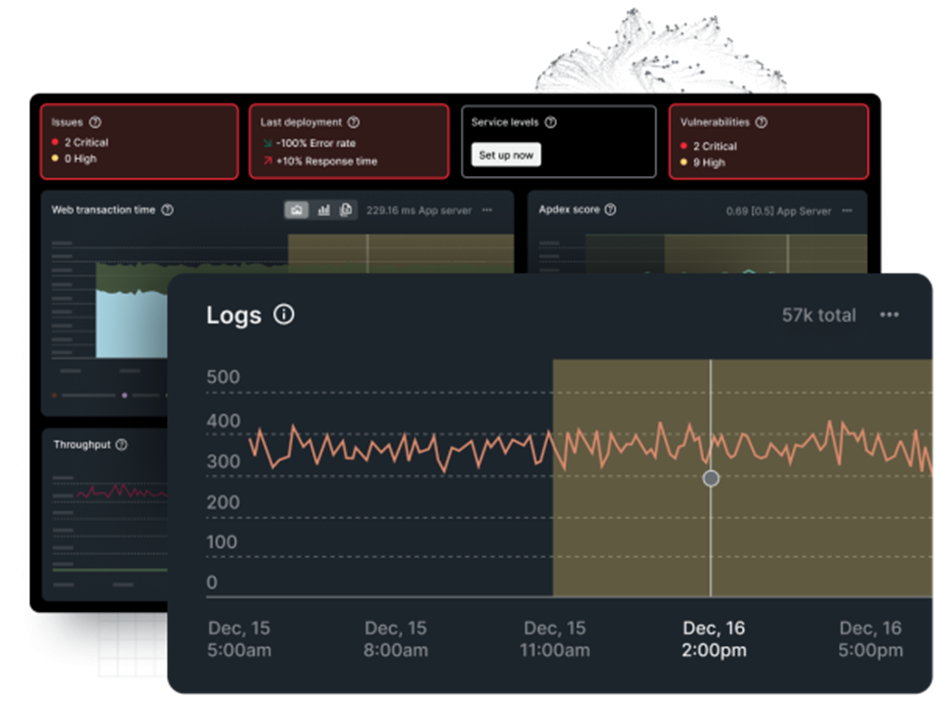
This platform is a cloud-based observability solution that gives insights into applications and infrastructure and allows users to respond to events in real time. ServiceNow, formerly known as Lightstep, works in real time to provide its insights into applications and infrastructure, making it handy for live monitoring. Like many other platforms, it offers automatic event detection and causal analytics, making it easy for developers to troubleshoot issues they would otherwise spend hours on. Additionally, the platform allows users to collect and visualize large amounts of data from millions of customers. The software also comes with advanced troubleshooting capabilities.
Here are some features of ServiceNow:
- Unified dashboard: With ServiceNow’s dashboard, you can monitor, visualize, and analyze metrics from hundreds of services all in one place on the platform. This gives developers next-level visibility into the health.
- Cloud logging and investigative notebooks: ServiceNow keeps detailed logs and collects in-context data, allowing development teams to analyze large volumes of context-specific data and quickly understand problems.
7. New Relic
©2008-24 New Relic, Inc. All rights reserved.
This hybrid observability platform provides full-stack infrastructure and application monitoring using a host of tools. With over 500 third-party integrations, New Relic can be integrated into many different workflows. Like many other top tools, the platform provides automatic event notification and error analysis. Additionally, New Relic has a detailed log management system for error tracking. New Relic even has a free version that gives access to 30-plus capabilities and 100GB/month ingest.
Features of New Relic include the following:
- Unique AI assistant: The platform prides itself on its one-of-a-kind AI assistant. Using a generative chat, New Relic AI can find and fix problems, translate query results, improve alert coverage, add new users to the team, and more.
- Free version: Unlike many other observability solutions, New Relic has a completely free version (not just a trial period) with several capabilities.
- Collaboration: New Relic can be integrated into Slack to simplify communication among team members.
- Cloud-based and mobile monitoring: New Relic gives end-to-end visibility into mobile apps and cloud-based infrastructure.
Conclusion
In conclusion, there are several observability platforms for gaining insights into the health of your IT infrastructure and services. The above were just seven of the best observability tools in 2024. From SolarWinds to New Relic, each platform comes with a unique set of advantages to make it stand out from the rest. Whether you’re trying to troubleshoot errors or simply monitoring the health, SolarWinds Observability Self-Hosted (formerly known as Hybrid Cloud Observability) will be your best choice.
This post was written by Jo Efobi. Jo is a Software Engineer with a degree in Neuroscience. She has worked with the MERN stack, Vue,js, Python, and Golang. She loves contributing to open source and exploring the intersection of medicine, healthcare and technology.
Leave a Reply