You’re probably familiar with the phrase, “software is eating the world.” In the last couple of decades, the importance and pervasiveness of technology in our society and our lives reached levels past generations would consider the realm of science-fiction. You probably have in your pocket, right now, a computer way more powerful than the one in Apollo 11.
With every passing year, humankind creates more information than in the rest of history, combined. Technology runs the modern world, and a vital piece in this ingenious machinery is the database. Being such a crucial part of…well, pretty much everything, it should go without mention that taking care of our databases should be of paramount importance. Database monitoring tools play an important role.
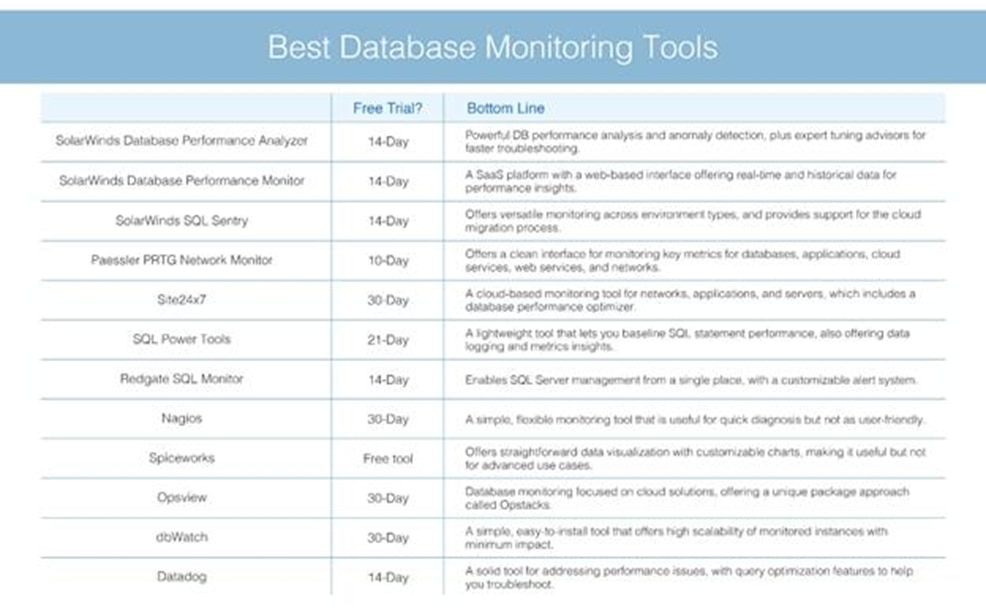
We’ll walk you through the ten database monitoring tools you should check out. Before we get to the tools themselves, we have to prepare the ground for them, so to speak. We’ll have some introductory sections, in which we’ll answer questions such as:
- What does “database monitoring” mean?
- Why should I care about database monitoring?
- How do people perform it?
- What are the main best practices to follow when it comes to database monitoring?
By the end of the post, you’ll have a solid understanding of the importance of database management and the main metrics you need to keep track of. You’ll also learn ten of the best database monitoring tools available, and you’ll be able to choose the best one for your needs.
Defining Database Monitoring
Let’s start with the basics. Database monitoring is the process of monitoring database performance. Keeping track of important performance metrics gives you the chance to improve on them, so you can keep your database working as fast and reliably as possible. And since the database is in most cases at the center of technological operations, any improvement in database performance will resonate across all layers of the system, improving the overall user experience for the whole application infrastructure.
A solid database monitoring approach analyzes a wide number of variables, so it’s possible to prevent—or at least minimize—unavailability and other problems.
Database monitoring typically tracks metrics in real-time, so IT professionals can react faster to problems, diagnosing and fixing them before they disturb the user experience.
These tools periodically take snapshots of the performance metrics they track, making it possible to identify with high precision when issues first appeared, which in turn allows you to get to the bottom of the issue faster.
Why Should I Use Database Monitoring?
As we’ve already mentioned, databases are most of the time at the center of technological operations, which means their performance and overall efficiency is very important. Poor database performance means poor application performance overall. Poor application performance results in unhappy customers who quickly morph into former customers.
To avoid this, you want your database to always be performing at the top of its game. That’s where a robust database monitoring approach is useful. Here are some of the benefits it can bring you:
- Faster diagnosis and fixing of database issues
- Insight into potential performance improvements
- Awareness of security issues
- Ability to be proactive rather than reactive to performance problems
- Finally, an improved user experience, which results from all of the above
How to Perform Database Monitoring
Common Approaches to Database Monitoring
Common approaches to database monitoring can be divided into two groups: proactive and reactive.
These approaches mean exactly what their names suggest. In the proactive approach, we try to identify warning signs before they become full-blown problems. The reactive approach, on the other hand, is all about alleviating the harm caused by existing problems.
Even though the reactive approach has its uses—mainly troubleshooting and incident response—the reactive approach is the most desirable one. Preventing problems before they happen is ideal, so your users don’t suffer from system disturbances.
However, the proactive approach requires you to keep track of the right metrics.
Key Metrics to Track
Query Execution Performance
Many performance problems can be caused by inefficient SQL queries, which include things like tables lacking indexes and inefficient joins. So, tracking query performance is an essential metric to monitor.
Hardware
The hardware is the base of everything, so it makes sense to track hardware-related metrics as well, including:
- Lack of memory
- Insufficient processing power
- Lack of free space in the disk
- Misconfigured disks
Concurrency Problems
When many users access your database simultaneously, you might experience conflicts in queries and other activities. Slow queries can cause page locking. Batch activities might cause resource contention. All these problems can negatively impact the performance of your database.

Database Monitoring Best Practices
- Monitor Changes to the Database A new application version often causes many changes to the database, which involves adding, changing or dropping database objects. It’s essential to monitor such changes, since these new or modified objects can cause performance issues.
- Measure Throughput Throughout metrics, such as replication latency, are crucial for creating comparative baselines you can use to quickly identify anomalies. By closely following these metrics, you can identify their normal value. Afterward, you’ll be able to compare this baseline value with current metrics, allowing you to identify suspicious deviations. To determine this baseline, you can’t take the value of a single or few readings. With so few samples, you wouldn’t have a way to know for sure they’re not outliers. Instead, take multiple readings over an extended time (about four weeks.)
- Monitor Availability and Consumption of Resources This practice is two-fold. It consists of verifying the database is online and checking the consumption of resources. How is CPU usage? How is memory usage? Is the disk close to being full? If any of these metrics are looking bad, your database monitoring tools should alert the person responsible for that area.
- Track Database Logs Collecting and monitoring database logs is essential if you want to practice proactive monitoring. These logs contain critical information you don’t typically find in general performance metrics, such as the time it took for each query in the database to run.
Top 12 Database Performance Tools
SolarWinds Database Performance Analyzer
SolarWinds® Database Performance Analyzer (DPA) is a popular tools among network administrators due to its unique take on database monitoring, which recognizes database response time as the most valuable performance metric.
DPA allows database administrators to tune and improve SQL query performance by relying on the response time analysis methodology. The tool’s multidimensional root cause analysis looks at:
- SQL statements
- Wait-based analytics
- System health
- Response time analysis
With this methodology, DPA allows IT teams to act based on a concrete metric—the time it takes to complete operations—instead of making predictions whose reliability varies wildly. Response time analysis enables teams to precisely determine what’s harming the application’s performance, by breaking down the time into a series of measurable steps.
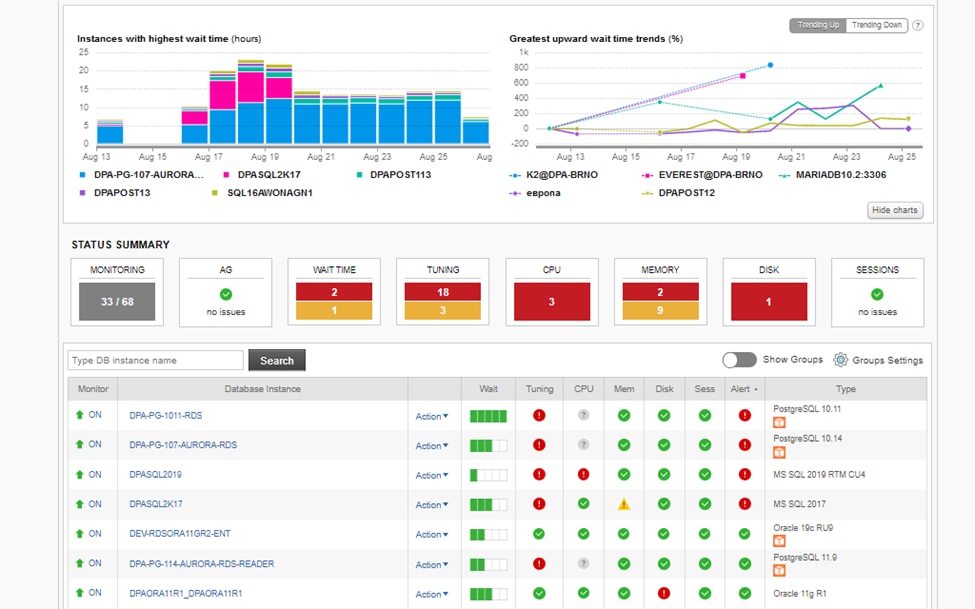
DPA then displays the results of this process using a dynamic UI. DPA’s dashboard clearly shows the most important information.
These integration capacities, along with all the other feature advantages you’ve just seen, make DPA one of the best database monitoring tools. You can try DPA today with a 14-day free trial.
SolarWinds Observability
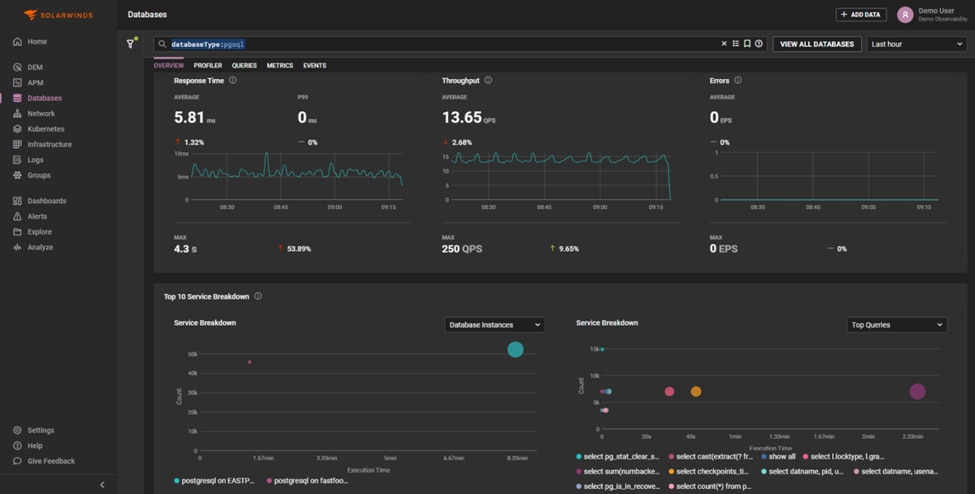
The second item in our list is another SolarWinds offering – SolarWinds Observability. It provides database performance insights and visibility previously known from Database Performance Monitor (DPM). The main difference between SolarWinds Observability and DPA has to do with how they’re used and what platforms they target. While DPA is a cross-platform application targeting self-hosted enterprise databases, Observability is a SaaS (software as a service) solution that goes beyond performance analysis and focuses on monitoring the health of open-source and NoSQL databases like PostgreSQL, MongoDB, Redis, and MySQL. It monitors databases in the cloud, locally, and hybrid. SolarWinds Observability works via lightweight agents supporting multiple configurations.
With database health, it offers convenient 24/7 real-time monitoring to help you track and improve metrics like availability, deploy frequency, reduced failed deploys, lead time for changes, Mean Time to Detection (MTTD), Mean Time to Repair (MTTR), and more. By monitoring thousands of metrics and displaying them using an intuitive interface with zoom-in and drill-down capabilities, you can diagnose and resolve issues faster. The solution helps minimize infrastructure costs, reduce performance bottlenecks, and increase visibility to your database thus fostering collaboration between teams. You can try this tool 30 days for free here.
SolarWinds SQL Sentry
There are plenty of benefits to SolarWinds® SQL Sentry®, making it worth looking at for any database management team. One of the main draws of SQL Sentry is its ability to monitor physical and virtual environments, including SQL databases in the cloud—meaning you can view metrics from a SQL Server® on Hyper-V® and VMware®, an Azure® and Azure Database Managed Instance, and your physical SQL Servers.
SQL Sentry provides versatile monitoring for over 800 different SQL Server database instances, making it especially helpful if you’re migrating from on-prem to the cloud, which businesses are doing increasingly in today’s cloud-based environments. You can use SolarWinds solutions to help manage cloud transition with solid documentation. Any cloud migration requires accurate documentation of your on-premises database for a successful transition, and SQL Sentry has documentation available before and after your migration to the cloud.
Another major draw is the DataOps feature, a SolarWinds unique answer to cross-stack performance monitoring. DataOps lets you view your performance metrics from a central database dashboard to understand resource allocation and plan accordingly. The best database monitoring tools allow you to take action on metrics, not simply view them. DataOps helps bridge the gap between identifying issues and addressing the root cause by offering custom alerts to let you know when metric thresholds are exceeded.
SQL Sentry is designed explicitly for SQL databases. Since SQL is used in many of today’s database environments, SQL Sentry is invaluable to any enterprise monitoring team. You can also view metrics from multiple interfaces, so your entire database management team can access software-as-a-service (SaaS) without logging onto the same account.
When it comes down to it, database management aims to eliminate resource bottlenecks and improve the end-user experience. SQL Sentry is effective because it understands the complete process, from monitoring and identifying issues to helping you troubleshoot with root-cause analytics. It’s a comprehensive way to get your applications running as smoothly as possible—so you can protect your time, customers, and budget.
Paessler PRTG Network Monitor
Paessler PRTG Network Monitor can monitor Oracle, PostgreSQL, Microsoft SQL Server, and MySQL. It goes way just monitoring databases. The metrics PRTG can track include—but are not limited to:
- Applications
- Cloud services
- Web services
- Network metrics, such as packets, traffic, IPs, and more
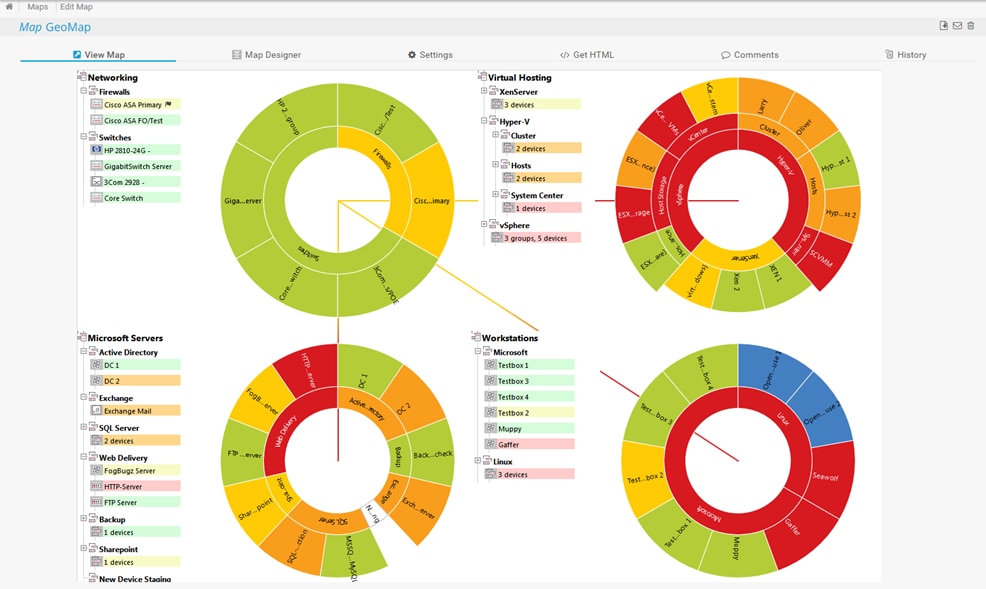
Besides its compatibility with many different databases and the ability to monitor your complete IT infrastructure, PRTG also shines when it comes to its interface. Its dashboard is flexible, customizable, clean, and easy to use. The dashboard features tabs for quick access to specific areas, such as notifications, alarms, logs, and more. It presents data and results in a clear way to help users save time.
PRTG offers an easy setup, which allows users to get up and running quickly. You can configure your own sensors or use preconfigured default ones. That way, if you don’t want to create your own configuration from the start, you can start monitoring right away with what PRTG offers out-of-the-box.
Site24x7
Site24x7 isn’t a specialized database monitoring tool. Instead, it’s a cloud-based monitoring service with monitoring capabilities for network, applications, and servers. The tool includes a database performance optimizer, which comes in its server monitoring package.
Site24x7 makes it easy to start monitoring your databases: it discovers them automatically and installs the agents to monitor them, allowing you to see the results using your browser.
Site24x7 has several other attractive qualities. Besides the ability to monitor an unlimited number of instances, it offers live performance metrics, customizable alert parameters, and a subscription-based pricing model.
SQL Power Tools
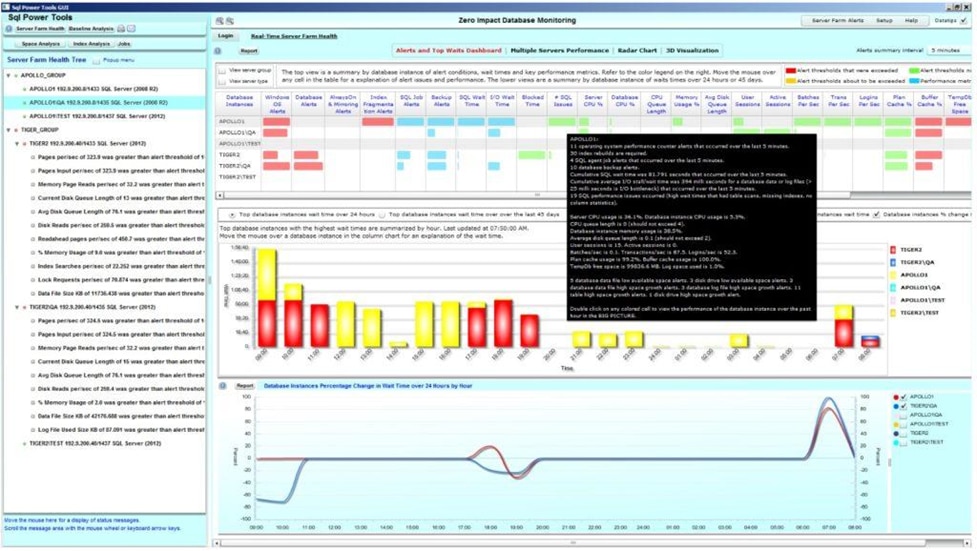
SQL Power Tools advertises itself as “zero impact database monitoring.” It is indeed a simple and lightweight tool and gives users a general view of their database’s performance. Despite its simplicity, the tool offers powerful features.
Its SQL text and analysis of end-user response time allows it to capture every SQL activity. SQL Power Tools can baseline the performance of every SQL statement.
Besides this powerful feature, SQL Power Tools also offers data logging of source and destination IP, response time, and bytes and packets sent. The tool also offers a wide array of metrics including:
- SQL wait conditions
- SQL wait times
- Blocking
- Deadlocks
- I/O stall times
- Disk usage
- Index fragmentation
- SQL agent job
Finally, SQL Power Tools offers great security features, which can help prevent SQL injection, DevOps attacks, phishing email attacks, and more, helping inform you of security incidents before data gets compromised.
Great features aren’t all that matters when it comes to a database monitoring solution, though. When it comes to the user experience, SQL Power Tools falls short compared to some of the previous tools in our list.
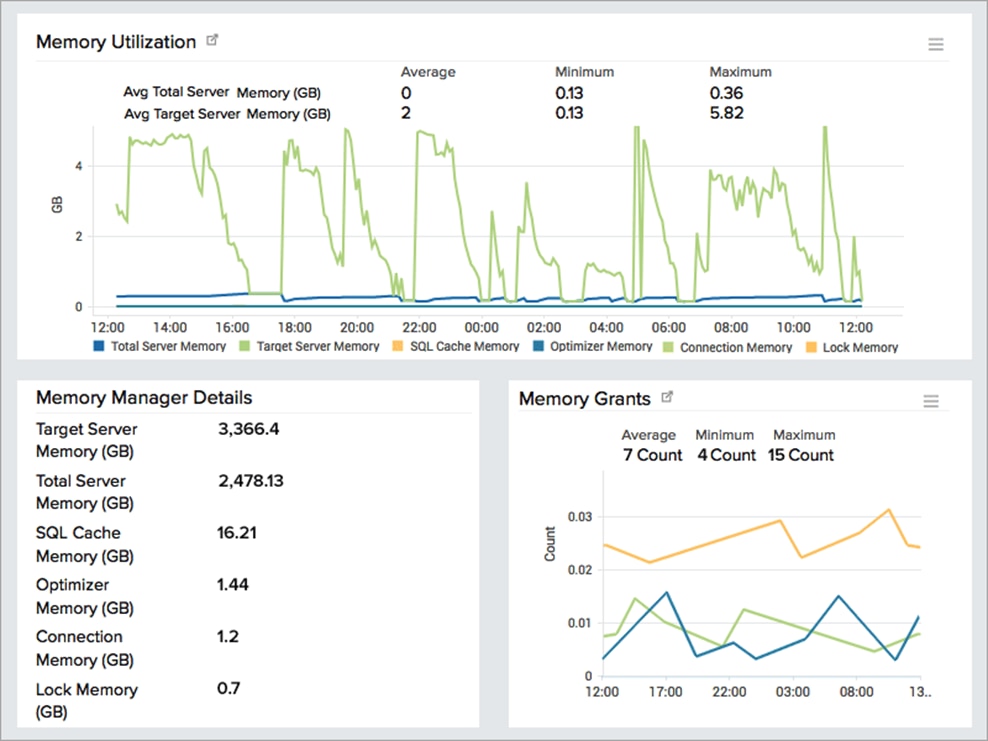
Redgate SQL Monitor
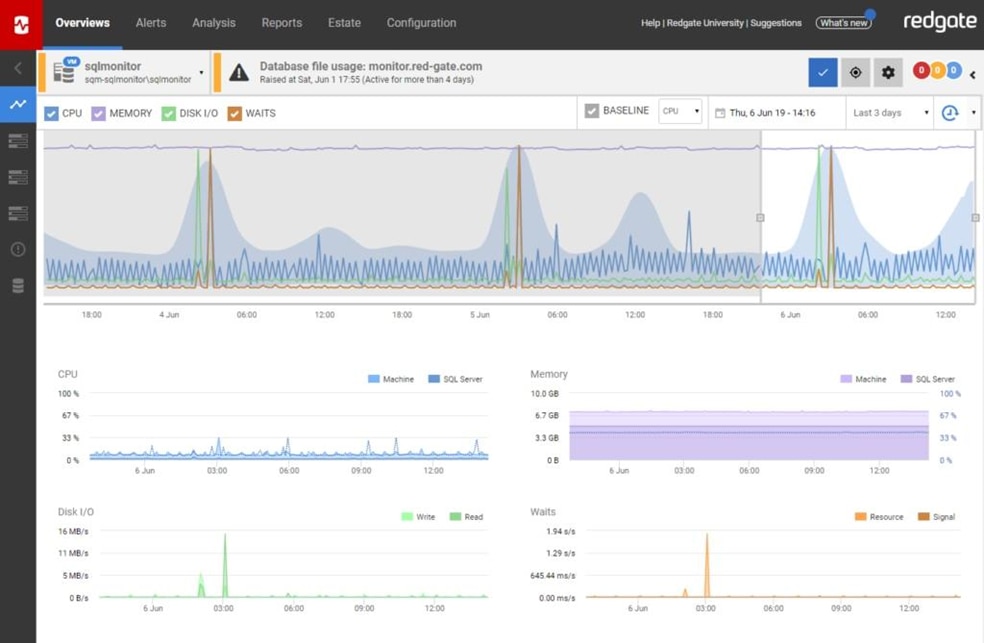
Redgate SQL Monitor features a great alert system, with 40 alerts to use out of the box, including issues with memory and CPU consumption, SQL errors, low disk space, and more. The alerts are also customizable.
SQL Monitor makes it easy to manage all your SQL Servers. You could have servers on virtual machines, or hosted locally, or on cloud providers. With the Redgate tool, you can monitor them all from a single place.
Another main selling point of Redgate SQL Monitor is its graphical interface, which has a nice look-and-feel and is user-friendly. The traffic light system in its GUI updates every 15 seconds. You can at a glance see what’s going on. Green? It’s fine. Amber? Oops, you’d better pay attention to this. Red? Time to take care of this.
Nagios
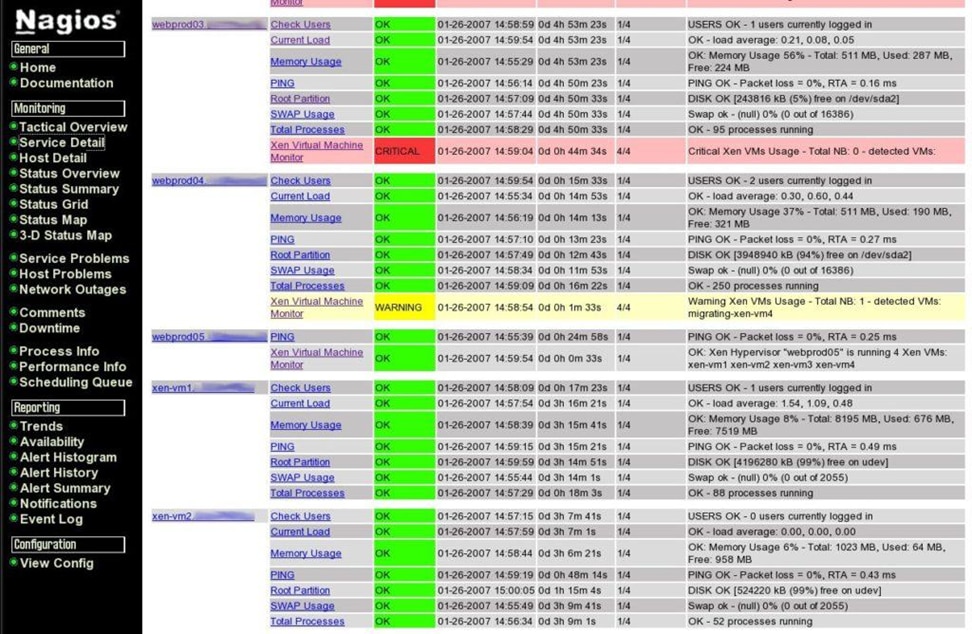
Nagios is a simple and flexible monitoring tool. It can monitor Microsoft SQL Server, Oracle, MySQL, Postgres, and DB2 databases. It comes in two versions: the open-source, community-driven Nagios Core, and the paid versions, “Nagios XI.”
As I’ve said, Nagios is super flexible, but its flexibility comes with a price: it’s not as user-friendly as other tools on the list. Both versions require you to add plugins to have more features. You can customize it to better suit your needs, but as the number of plugins installed grows, maintaining the whole system becomes harder and harder.
Nagios is a good tool. It’s simple, flexible, and good for quickly diagnosing a range of database problems. Its extreme flexibility, however, is a double-edged sword: it enables tool customization at the price of usability.
Spiceworks
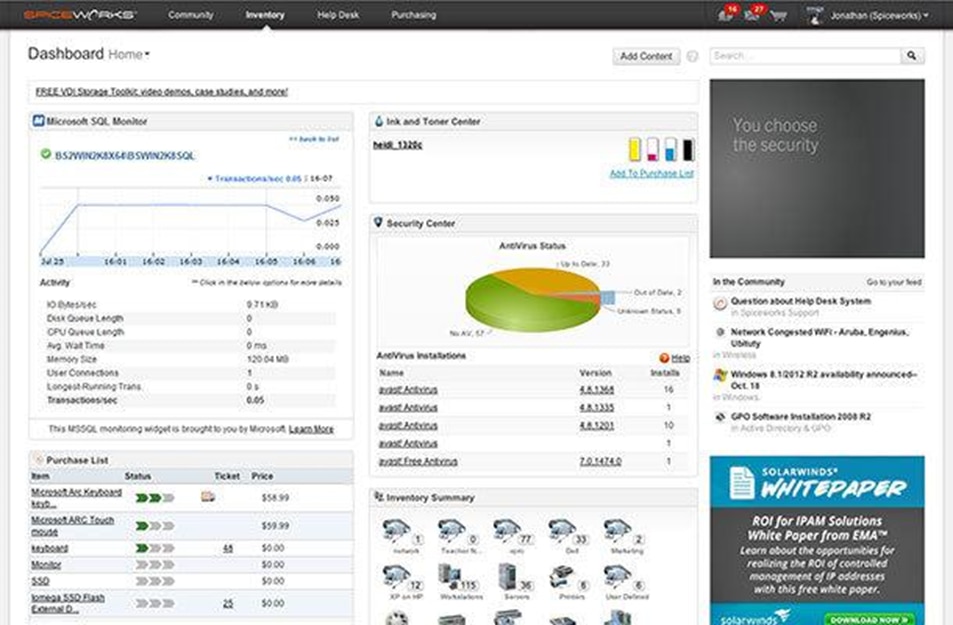
Spiceworks is a free tool compatible with SQL Server databases, from the 2005 version on. This tool offers a good design, featuring simple data visualization with customizable charts, which is uncommon for a free tool.
Spiceworks SQL Server Monitor is a basic tool. It might be the right tool for you if you don’t have advanced use cases and want a simple way to track the main metrics on your SQL Server.
Opsview
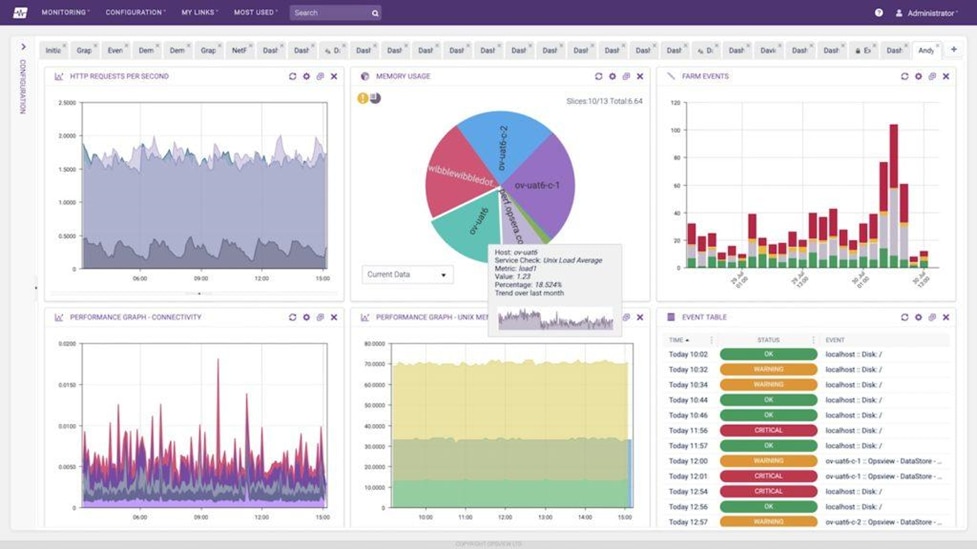
Opsview offers a range of database monitoring solutions focused on cloud solutions. However, its solutions—supporting Microsoft SQL Server, Oracle, MySQL, InfluxDB, and PostgreSQL—can be used both on-premises and in the cloud.
Opsview has a unique approach to monitoring. It allows users to configure it by using packages called Opspacks. When it comes to database monitoring, there are packs available for monitoring Exchange, MariaDB, LDAP, and several others.
Opsview, however, suffers from a problem common in this list: the flexibly vs. user-friendly dichotomy. When a tool adds more flexibility, it invariably causes the user experience to suffer. In the case of Opsview, the need for Opspacks makes the setup harder than some of its competitors.
dbWatch
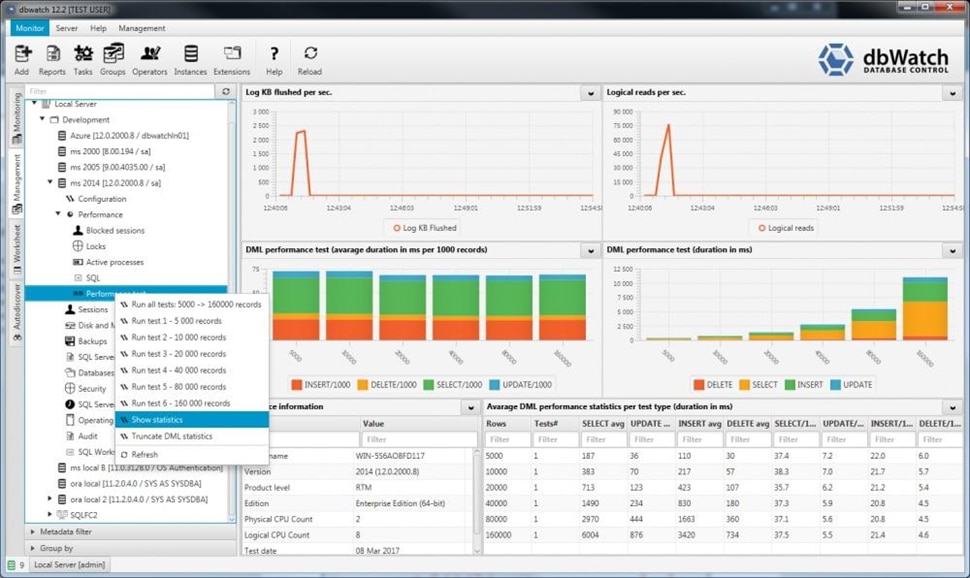
dbWatch is a simple, customizable, and easy-to-install tool. This cross-platform monitoring tool supports Oracle, Microsoft SQL Server, MariaDB, Postgres, MySQL, and Sybase. A main selling point of dbWatch is its high scalability, which allows you to increase the number of monitored instances in order of magnitude with minimum impact.
The tool also shines when it comes to reporting. It’s possible to generate reports from a single instance or for many. dbWatch monitors instances in real time and compiles historical data to enable comparative analysis.
dbWatch was created to cater to perceived changes in the database monitoring scenario. Its creators realized it’s essential to monitor your entire server farm instead of just individual instances.
The tool offers a global view, so you can monitor all your instances at once and “zoom in” on specific instances when you need to know more about it.
Datadog
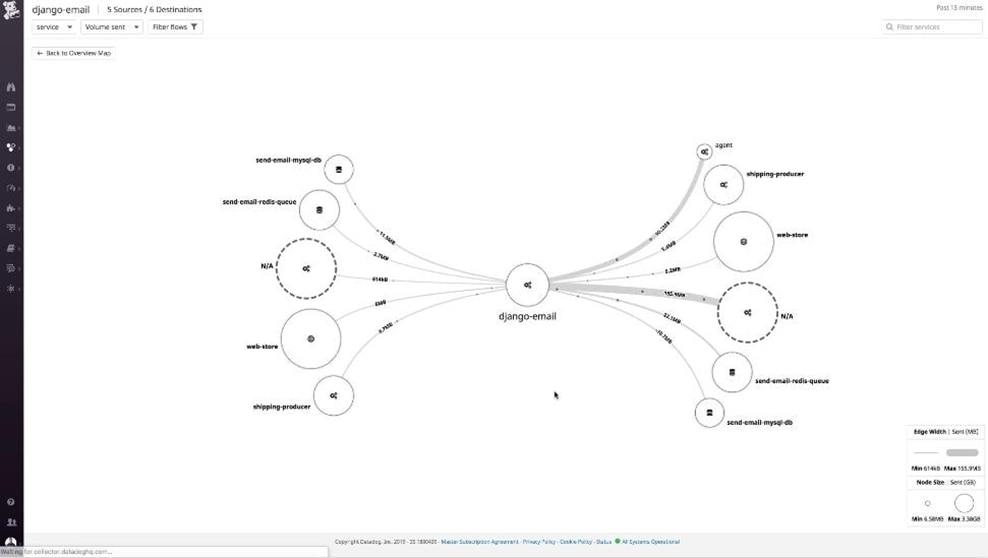
Datadog® is a helpful way to address performance issues in your database environment. Several features make Datadog appealing to database management teams with an eye for efficiency. Although Datadog doesn’t offer never-before-seen features unique to the Datadog approach, you can get much out of Datadog’s solid list of database management tools.
Addressing slow queries is a crucial part of any database management strategy, and Datadog has an excellent approach to query optimization. You can identify slow queries with an intuitive view of query metrics without writing any lines of code. You can also track query performance over time to see which queries are causing persistent bottlenecks. Once you identify slow queries, you can tune them accordingly.
Datadog doesn’t have an automated approach to query tuning, but it includes plenty of features making it a helpful tool for addressing bottlenecks. You can access Datadog’s monitoring tools from multiple workstations, meaning you won’t have to sign into one account for your whole team to use. A collaborative approach is a big focus of Datadog’s management solution, based on the understanding database management is a “team sport.”
You can manage database environments with scalable DBM access, adding or removing members whenever you want.
Plus, Datadog is a safe solution helping to comply with industry best practices. With an eye for database security, Datadog has valuable features like secure personally identifiable information (PII) obfuscation and login security for each team member. This means your team can manage databases while avoiding security compromises without gaining visibility into sensitive data points in your client’s database, allowing you to pass security audits with flying colors.
Datadog offers a core set of troubleshooting tools, making it a solid choice when you’re looking to improve database functionality. Resource metrics provide specific insight into problem areas, including general trend identification, allowing you to plan resource allocation accurately. And with the right ways to identify high resource consumption, you can plan accordingly for your organization’s future.
Wherever your team members are located, Datadog lets you improve your database environment one step at a time.
How to Choose the Best Database Monitoring Tool
Making a huge investment and then not caring about its ROI doesn’t strike me as a wise business choice. But many companies pour resources into their IT infrastructures—databases included—and then don’t bother to evaluate them. That’s why database monitoring and database monitoring tools are so important.
There are database monitoring tools for all preferences, tastes, use cases, and budgets.
Do you want to prevent your customers from becoming former customers? Keep track of the main metrics we’ve discussed, improve them, and the benefits will resonate throughout your whole application infrastructure, culminating in happier users.
This post was written by Carlos Schults. Carlos is a .NET software developer with experience in both desktop and web development, and he’s now trying his hand at mobile. He has a passion for writing clean and concise code, and he’s interested in practices that help you improve app health, such as code review, automated testing, and continuous build.