This article describes how to measure latch and spinlock contention. Read here to recognize the symptoms of latch and spinlock contention.
Measuring Latch Contention
A latch is like a lock on a piece of memory. As more threads get involved, they will start to compete to access the same pieces of memory, causing blocking. Blocking due to latch contention is exhibited in waits; but unlike a lock, a latch can be released as soon as the physical operation is completed.
The main sources of data about latches are two DMVs called sys.dm_os_wait_stats and sys.dm_os_latch_stats. The details of the values stored in these DMVs will be examined later in an explanation of latch modes and latch types, but for the purposes of recognizing the symptoms, a brief explanation will suffice. The DMVs are restarted when the service restarts, or when the DBCC SQLPERFcommand is called to clear them, as in the following code:
DBCC SQLPERF('sys.dm_os_wait_stats', CLEAR);
DBCC SQLPERF('sys.dm_os_latch_stats', CLEAR);
Among the columns of the DMV sys.dm_os_wait_stats are ones called wait_type, wait_time_ms and waiting_tasks_count. These three columns represent the wait type, the total number of milliseconds that have been spent waiting on this wait type, and the number of times this type of wait has occurred, respectively. Wait types that associate with latches start with LATCH_, PAGELATCH_, or PAGEIOLATCH_.
Dividing the total wait time by the number of waits will give an average wait time (I’d recommend wrapping the waiting_tasks_count column in the NULLIF function to avoid a division by zero error). By querying this DMV repeatedly over time (as in the following example, further illustrated in Figure 1), a picture can be built up of the frequency of latch waits, along with the amount of time the system must wait for these latches. This picture allows a database administrator to understand what kind of behavior is being exhibited — whether it matches Figure 7.1 or Figure 7.2.
SELECT
wait_type,
wait_time_ms,
waiting_tasks_count,
wait_time_ms / NULLIF(waiting_tasks_count,0) AS avg_wait_time
FROM sys.dm_os_wait_stats
WHERE wait_type LIKE 'LATCH_%'
OR wait_type LIKE 'PAGELATCH_%'
OR wait_type LIKE 'PAGEIOLATCH_%';
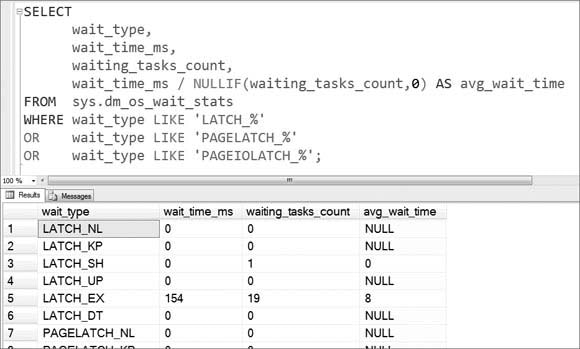
Figure 1.
The DMV called sys.dm_os_latch_stats lists similar statistics for latch classes.
Measuring spinlock contention
For the time being, you can think of a spinlock as a latch, except that if the memory needing access is not available, the spinlock will keep checking it (known as spinning) for a while. There is slightly more to it, but we won’t go into that here.
The main DMV for spinlocks is sys.dm_os_spinlock_stats. The metrics of concern for spinlocks are around collisions and spins_per_collision, which are both columns in this DMV, along with the name column for the type of spinlock. Here is an example of using sys.dm_os_spinlock_stats (code file Ch7Symptoms.sql), further illustrated in Figure 2:
SELECT name, collisions, spins_per_collision
FROM sys.dm_os_spinlock_stats
ORDER BY spins_per_collision DESC;
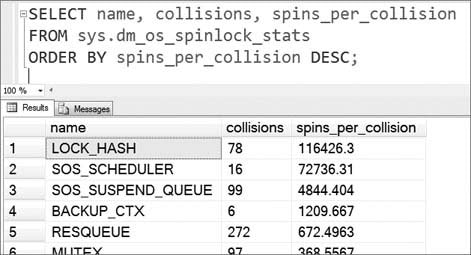
Figure 2.
The sys.dm_os_spinlock_stats DMV can also be cleared using DBCC SQLPERF.
Leave a Reply