If you ask several performance tuning specialists separately about the most irritating feature in the Oracle environment, very often you will hear exactly the same answer: the PL/SQL code wrapper. It is true that even Oracle uses it to protect internal packages. However, Oracle can be trusted to perform adequate testing and provide support if something still goes wrong. The real challenge starts when wrapped code is created by third-party vendors or outside contractors. In such cases, if you log a performance-related issue, it may sit unanswered for a very long time.
Many small organizations simply do not have the resources to provide extended research. Since you need to get the job done anyway, you must somehow shorten their response time to the problems logged. The difficulty lies in the fact that the code is wrapped. Of course, you can try various unofficial “unwrappers,” but doing so will violate the majority of license agreements. Alternatively, you can try to use the existing Oracle performance monitoring tools and get a sneak peek inside of the black box, as shown in the following example.
Assume that you have a vendor-provided wrapped package that contains a function returning a CLOB. This function takes a column name and table name and generates some fancy formatted output:
![]()
This function worked fine when tested on small tables, but for a TEST_TAB table with 50,000 rows, the performance became unacceptable. Before contacting the software vendor, it is always useful to perform a preliminary analysis. When dealing with scalability, the first step is to find out which resources are under the most stress. This will also lead you to the operations causing the stress, as shown in the following code:

Of course, many differences will be generated by the RUNSTATS_PKG, but something is immediately noticeable: To process 50,000 rows, the function used 50,000 LOB operations, and for some reason, all of these operations are direct. LOBs are processed using direct I/O operations only when the CACHE option is disabled. By looking at the report shown in the code, the likely suspect is too many NOCACHE LOB operations.
The second step confirms that suspicion. An interesting feature of the Oracle PL/SQL Hierarchical Profiler is that it ignores wrapped code and prints out actual PL/SQL unit names. This means that you can see what was actually fired:
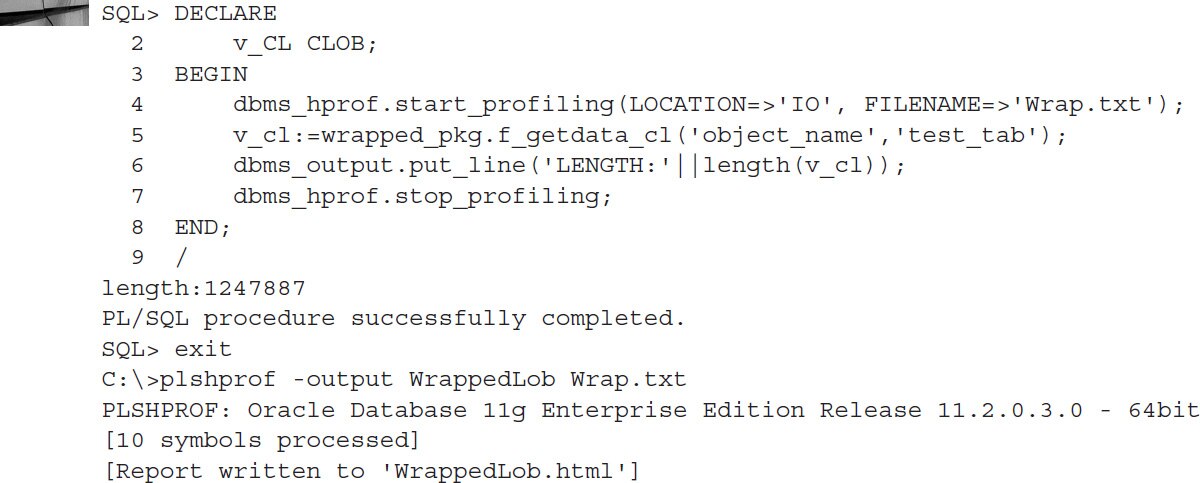
Figure 1 shows the profiler output in a readable format.
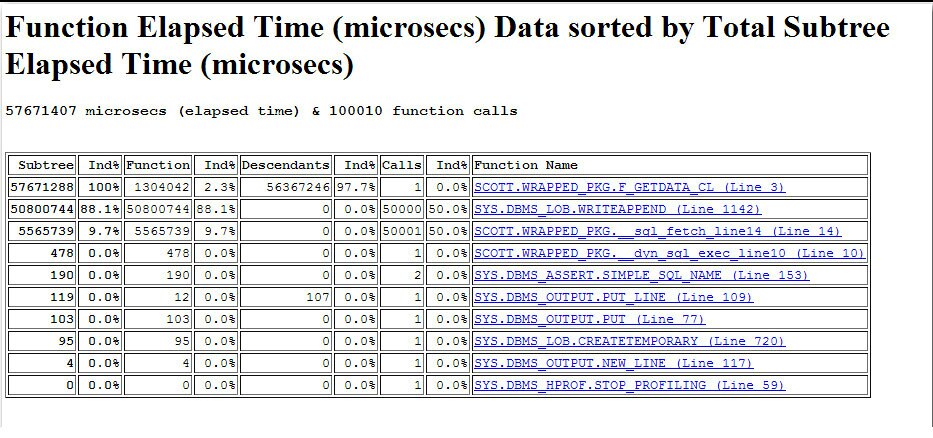
FIGURE 1. Hierarchical Profiler showing a Subtree Elapsed Time report
Obviously, the suspicions were confirmed. There are indeed 50,000 calls to DBMS_LOB.WRITEAPPEND (one for each fetched row). There is also a call to create a temporary LOB using DBMS_LOB.CREATETEMPORARY. Note the fact that the package is wrapped is completely ignored. Even if you cannot see a lot of details, you can at least get an idea of which program modules are being fired. Now, you have every piece of information required. You know precisely why WRAPPED_PKG is performing badly for the large volumes of data. This means that you can expect a fast (or at least a faster) response when communicating with the vendor.
To satisfy your curiosity, the following code shows the unwrapped content of WRAPPED_PKG package:
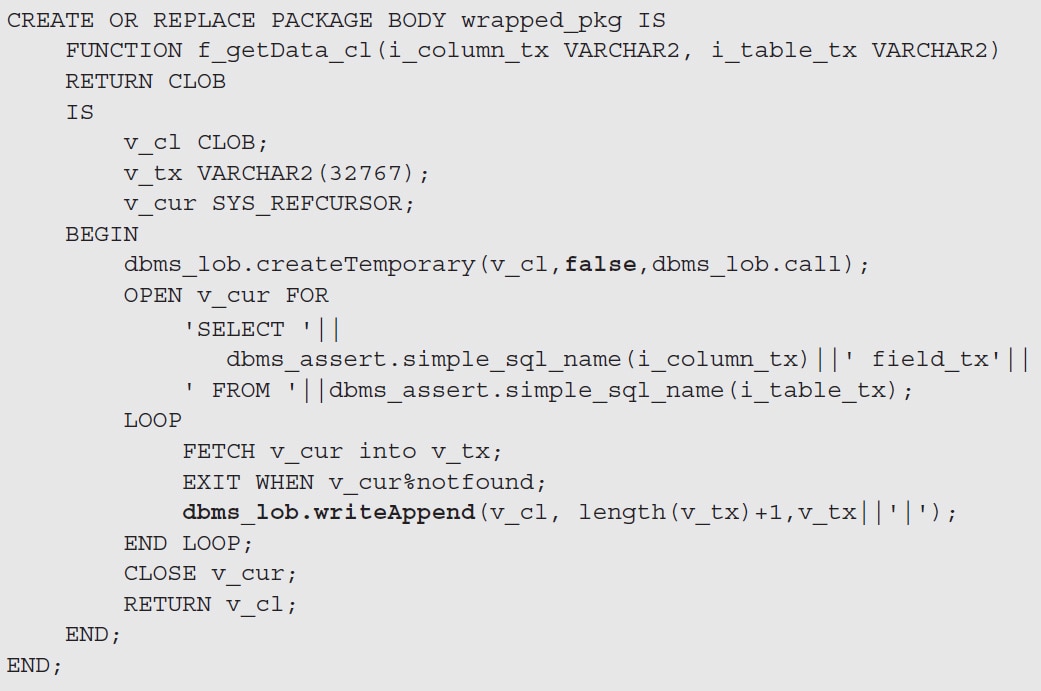
This case is based on the authors’ actual experience. One of the third-party providers did indeed have CACHE=>FALSE set in DBMS_LOB.CREATETEMPORARY. We certainly understood their reasoning: They did not want to use too much buffer cache. However, for the purposes of our application, the setting was wrong. After we contacted the vendor, they agreed to parameterize that setting as a one-off fix.
Leave a Reply