A low library cache hit ratio is a symptom of one of several problems. The shared and/or Java pools may be too small; the SHARED_POOL_RESERVED_SIZE may be too small; CURSOR_SHARING may need to be set to FORCE; there may be inefficient sharing of SQL, PL/SQL, or Java code; or there may be insufficient use of bind variables. Investigate which application code is being used over time and how efficiently it is used (code sharing). Monitor the shared and Java pool freespace over time. If the amount of free memory in the shared and Java pools is relatively high, no ORA-04031 errors are occurring, and the library cache hit ratio is low, then poor code sharing is probably occurring.
The queries in the following listings help you investigate this area. I include some V$ view queries here because of the applicable nature to this subject.
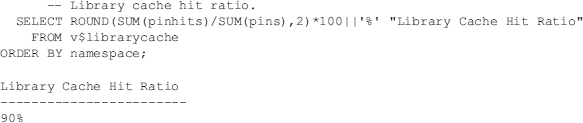
Library cache hit ratio
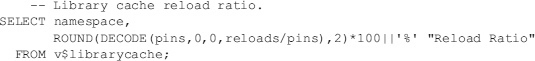
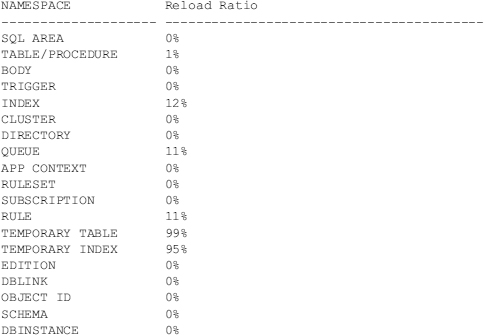
Library cache reload ratio
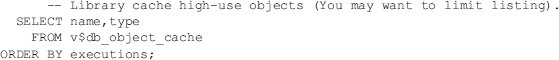
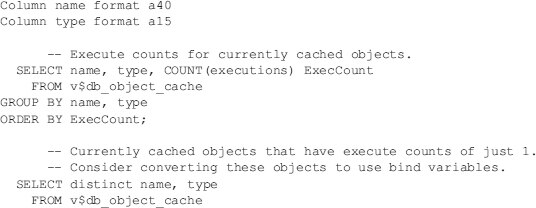
Library cache high-use objects (make this a top 10 list by adding “WHERE ROWNUM<11”)
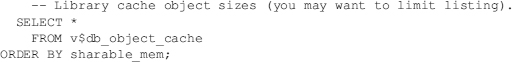
Library cache object sizes
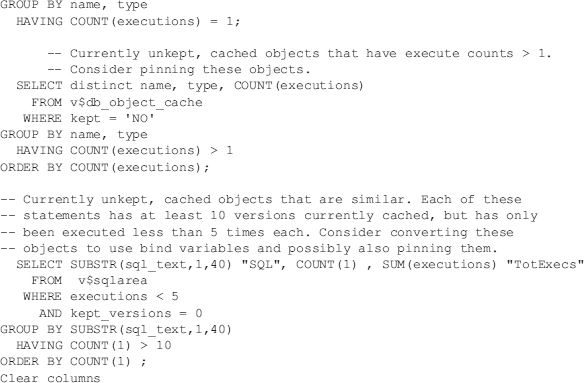
Shared pool object sharing efficiency (you may want to limit these)
A high percentage of reloads indicates that the shared and/or Java pools are too small, code sharing is insufficient, and possibly also large code objects are repeatedly being used. Monitor the application code used over time. If particular large code objects are identified as frequently used, consider pinning them and/or increasing the size of the SHARED_POOL_RESERVED_SIZE. If features such as Shared Servers, Recovery Manager, or Parallel Query are used, consider a larger SHARED_POOL_SIZE and/or larger LARGE_POOL_SIZE (if setting parameters like MEMORY_TARGET and/or SGA_TARGET, ensure you always set a minimum for the SHARED_POOL_SIZE even if you use these other parameters).
Leave a Reply