For optimal performance, you’ll want to keep the library cache reload ratio [sum(reloads) / sum(pins)] at zero and the library cache hit ratio greater than 95 percent. If the reload ratio is not zero, then statements are being “aged out” that are later needed and brought back into memory. If the reload ratio is zero (0), it means items in the library cache were never aged or invalidated. If the reload ratio is greater than 1 percent, the SHARED_POOL_SIZE parameter should probably be increased. Likewise, if the library cache hit ratio comes in less than 95 percent, then the SHARED_POOL_SIZE parameter may need to be increased. Also, if you are using ASMM, the SGA_TARGET includes both auto-tuned and manual parameters. When you decide to raise a parameter specifically (such as SHARED_POOL_SIZE), it influences the auto-tuned part. (Other parameters are affected; see Metalink notes 443746.1 and 295626.1, “How to Use Automatic Shared Memory (AMM) in 11g and How to Use Automatic Shared Memory Management (ASMM) in Oracle 10g.”)
You can monitor the library cache in a couple of ways. The first method is to execute the STATSPACK report. The second is to use the V$LIBRARYCACHE view.
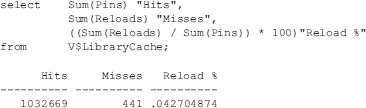
The following query uses the V$LIBRARYCACHE view to examine the reload ratio in the library cache:
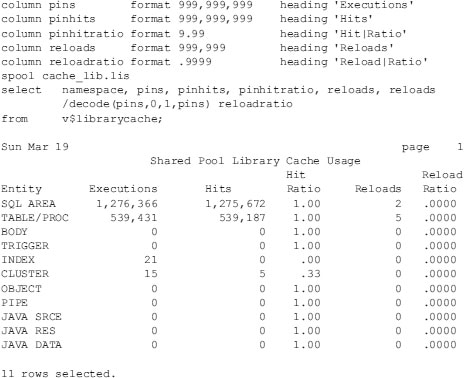
This next query uses the V$LIBRARYCACHE view to examine the library cache’s hit ratio in detail:

This hit ratio is excellent (greater than 99 percent) and does not require any increase in the SHARED_POOL_SIZE parameter.
Using Individual Library Cache Parameters to Diagnose Shared Pool Use
Using a modified query on the same table, you can see how each individual parameter makes up the library cache. This may help diagnose a problem or reveal overuse of the shared pool.
Use the following list to help interpret the contents of the V$LIBRARYCACHE view:
-
namespace The object type stored in the library cache. The values SQL AREA, TABLE/PROCEDURE, BODY, and TRIGGER show the key types.
-
gets Shows the number of times an item in library cache was requested.
-
gethits Shows the number of times a requested item was already in the library cache.
-
gethitratio Shows the ratio of gethits to gets.
-
pins Shows the number of times an item in the library cache was executed.
-
pinhits Shows the number of times an item was executed when that item was already in the library cache.
-
pinhitratio Shows the ratio of pinhits to pins.
-
reloads Shows the number of times an item had to be reloaded into the library cache because it aged out or was invalidated.
Keeping the Pin Hit Ratio for Library Cache Items Close to 100 Percent
The pin hit ratio for all library cache items—sum(pinhits)/sum(pins—should be close to 1 (or a 100 percent hit ratio). A pin hit ratio of 100 percent means that every time the system needs to execute something, it is already allocated and valid in the library cache. Although you will always experience some misses the first time a request is made, misses can be reduced by writing identical SQL statements.
TIP
Measure hit ratios for the library cache of the shared pool with the V$LIBRARYCACHE view. A hit ratio of greater than 95 percent should be achieved. However, when the database is initially started, hit ratios are around 85 percent.
Keeping the Miss Ratio Less Than 15 Percent
The miss ratio for data dictionary cache sum(getmisses)/sum(gets) should be less than 10 to 15 percent. A miss ratio of zero (0) means that every time the system went into the data dictionary cache, it found what it was looking for and did not have to retrieve the information from disk. If the miss ratio “sum(getmisses)/sum(gets)” is greater than 10–15 percent, the initialization SHARED_POOL_SIZE parameter should be increased.
Leave a Reply