The data dictionary cache is a key area to tune because the dictionary is accessed so frequently, especially by Oracle’s internals of Oracle. At startup, the data dictionary cache contains no data. But as more data is read into cache, the likelihood of cache misses decreases. For this reason, monitoring the data dictionary cache should be done only after the system has been up for a while and stabilized.
If the dictionary cache hit ratio is less than 95 percent, then you’ll probably need to increase the size of the SHARED_POOL_SIZE parameter in the initialization parameter file. Implementing locally managed tablespaces (LMT) can also help your dictionary cache (see Metalink note 166474.1, “Can We Tune the Row Cache!”). However, keep in mind that the shared pool also includes the library cache (SQL statements), and Oracle decides how much of the distribution is for the library cache versus the row cache.
Use the following query against the Oracle V$ view to determine the data dictionary cache hit ratio:

TIP
Measure hit ratios for the row cache (data dictionary cache) of the shared pool with the V$ROWCACHE view. A hit ratio of greater than 95 percent should be achieved. However, when the database is initially started, hit ratios will be around 85 percent.
Using Individual Row Cache Parameters to Diagnose Shared Pool Use
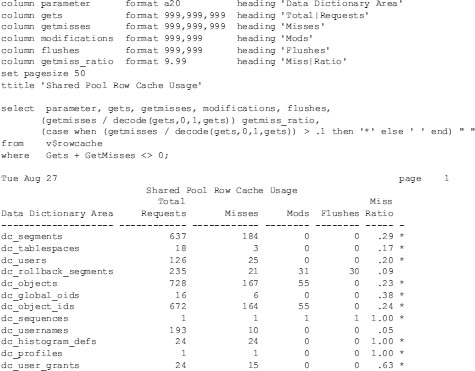
To diagnose a problem with the shared pool or overuse of the shared pool, use a modified query to the V$ROWCACHE view. This shows how each individual parameter makes up the data dictionary cache, also referred to as the row cache (partial listing):

This query places an asterisk (*) for any query that has misses greater than 10 percent. It does this by using the CASE expression to limit the miss ratio to the tenth digit and then analyzes that digit for any value greater than 0 (which would indicate a hit ratio of 10 percent or higher). A 0.1 miss or higher returns an *.
Leave a Reply