In an ideal system, the number of transactions per second increases as traffic increases, and adding extra processor threads can help to resolve this. Having more processor threads should result in better performance, but it could lead to latch and spinlock contention instead. Over recent years, processors have not increased significantly, but the number of processors per server, cores per processor, and threads per core through hyperthreading have all been increasing, resulting in systems that are often scaled up by adding processor threads.
So it’s important to recognize the signs of latch and spinlock contention.
Recognizing symptoms of latch and spinlock contention
If your transactions per second figure is dropping as you enable extra processor threads, and your average latch waits are increasing at a rate greater than the throughput, then you quite possibly have a problem with latch contention. Consider the following two images. One represents how you want your system to behave, and the other, the effect of latch contention.
Both images show the number of transactions per second and average latch time (how to get this information will be shown soon).
Figure 1 represents the behavior that you should see when adding threads.
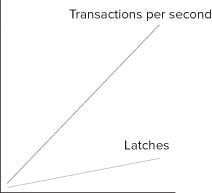
Figure 1.
However, your chart may look more like the one shown in Figure 2. Notice the number of transactions per second starting to decrease after a point, and the number of latches increasing significantly.
In Figure 1, the ideal behavior shows the average latch time increasing a little as the number of processors increases, but not significantly. The number of transactions per second is happily increasing, suggesting that the processors are not conflicting with each other too much; and the more processors there are, the more can be done.
But in Figure 2, adding processors was proving useful but only up to a point. The effect of latch waits started to kick in, preventing the benefit of extra processors from being realized. It even got to the unhappy point of reducing the amount of work that could actually be done. This caused problems, rather than solving them. With the system spending so long waiting, the impact on real work becomes negative.

Figure 2.
In order for spinlock contention to be a concern, behavior as described by the chart shown in Figure 3 would be exhibited, with the CPU rising exponentially as the load increases, with transactions dropping as with the latches. Keep in mind that you should also eliminate other factors that may be responsible for the increased CPU load.
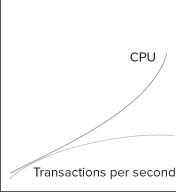
Figure 3.
Sometimes the obvious needs to be stated — you need a benchmark to tell you what “good performance” looks like, to weigh against what you’re seeing when troubleshooting. When you examine a system without any historical background, you can sometimes recognize undesirable behavior, but a particular system could easily exhibit symptoms that are typical for it. Doctors use benchmarks when testing their patients — some of whom exhibit levels that are not typical across a broad population but are fine for them.
When you, in your role as database surgeon, open Performance Monitor, or PerfMon, and start looking at the various levels, it helps to know what those levels were before the problems started.
[…] This article describes how to measure latch and spinlock contention. Read here to recognize the symptoms of latch and spinlock contention. […]