In today’s world, every business relies on its network infrastructure to achieve its goals. It’s, therefore, critical to monitor your network infrastructure and be aware of how efficient it is. You can achieve this through network observability.
What Is Network Observability?
The 3 Key Factors of Network Observability
Benefits of Network Observability
5 Top Tools for Network Observability
- SolarWinds Observability Self-Hosted (formerly known as Hybrid Cloud Observability) (30 Days Free Trial)
- SolarWinds Observability SaaS (formerly known as SolarWinds Observability) (30 Days Free Trial)
- Dynatrace
- Datadog
- Kentik
This post will dive into network observability, some key factors, and five tools you can use.
What Is Network Observability?
Network observability refers to the ability to get visibility and comprehensive insight into the internal state, behavior, function, and performance of your network infrastructure. You can do this by collecting, analyzing, visualizing, and correlating telemetry data from various sources—from simple routers to the server and applications—within the network infrastructure.
The 3 Key Factors of Network Observability
Three key factors are essential to network observability: logs, metrics, and traces. These factors help organizations automate their analytics and glean insights from their telemetry data that lead to intelligent actions.
1. Logs
Logs are immutable system events and error records in plain text or binary and are structured with metadata like the timestamp, event type, and machine or user ID. These records are generated for almost every piece of network activity. Logs are extremely valuable because their metadata provides a level of granularity that you can use for debugging.
To achieve full observability with the metadata obtained from the logs, you need to collect and correlate them from various system components. A single log from a single component of your system can’t provide complete contextual insights.
2. Metrics
Metrics are numerical, quantitative values that define how well your system’s performance is doing over time. These values are often statistically calculated, summarized, aggregated, correlated, or averaged over time to identify anomalies, patterns, and trends.
These values are critical for observability because you can use them to set baselines and step ahead through key performance indicators (KPIs).
3. Traces
Traces represent the lifetime of a request as it crosses your network. Unlike logs and metrics, they provide visibility when it comes to your request journeys. These values are so important when it comes to observability because by simply analyzing your trace, you can get insight into health, response times, error rates, and throughput. You can also proactively address potential issues. For example, you can use network traces to identify packet-level data, monitor latency, and detect network intrusions, malware, and other security threats. However, it’s important to note that network tracing generates a lot of data, so focusing on specific issues is crucial to avoid information overload.
Benefits of Network Observability
Network observability is important because it helps organizations do the following:
- Debug, identify the root cause anomalies, and troubleshoot network issues quickly
- Get real-time visibility across and into the network infrastructure’s internal state, effectiveness, and performance
- Enhance security posture and eliminate unused resources cost at scale
- Better optimize the network efficiency and reliability
- Move from a reactive to a proactive posture by providing unified insights across the network infrastructure
- Have a holistic view of network behavior, which can be leveraged to make informed data-driven decisions
By understanding and embracing network observability, businesses can have a holistic view of network behavior, which they can leverage to make informed data-driven decisions to achieve goals.
But how does network observability differ from network monitoring?
Observability vs. Monitoring
The fundamental difference between monitoring and observability lies in the fact that monitoring is reactive, and observability is proactive.
Monitoring uses metrics to alert you when something goes wrong. It focuses on the status of the system. It also shows long-performance trends. However, monitoring doesn’t tell you the underlying reason for the issue, which is very important, especially in a highly complex distributed system.
Observability collects data from your IT environment and tells you what’s wrong and why it happened. It achieves this by analyzing, visualizing, and correlating the collected telemetry data. The detailed contextual knowledge it provides can help you better understand, identify, and resolve the root cause of issues. Observability also reveals the “unknown unknowns,” the issues you weren’t even aware of.
In a nutshell, a monitoring solution can tell you something is wrong but not why. An observability solution can answer the what, how, and why.
5 Top Platforms for Network Observability
Here are a few observability tools that can help you get started:
1. SolarWinds Observability Self-Hosted (formerly known as Hybrid Cloud Observability) (30 Days Free Trial)
©2024 SolarWinds Worldwide, LLC. All rights reserved.
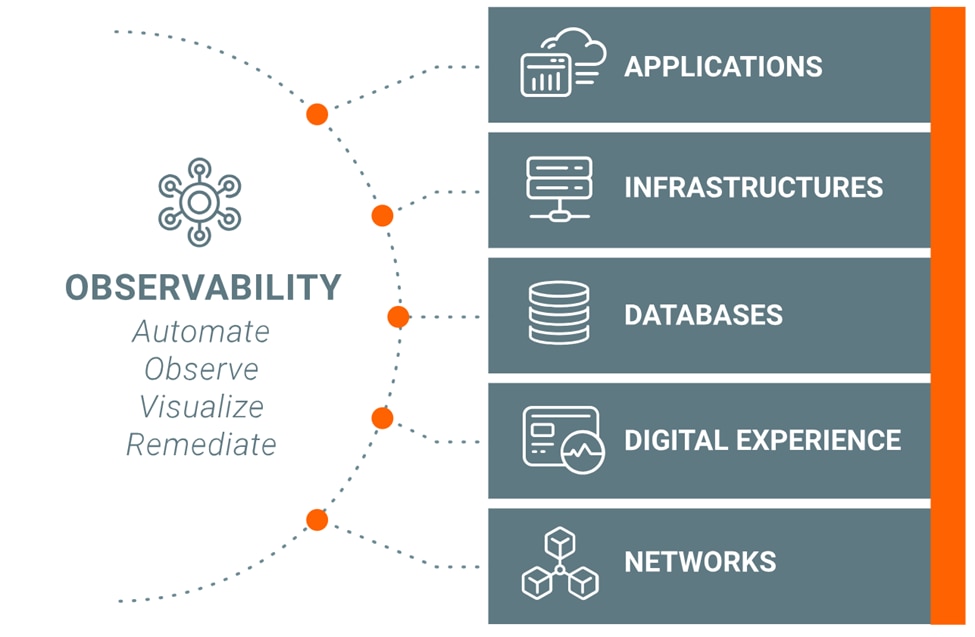
SolarWinds Observability Self-Hosted (formerly known as Hybrid Cloud Observability) is a self-hosted, comprehensive, full-stack observability solution built on SolarWinds® for your hybrid cloud environment. This platform leverages the data collected to monitor health and gives you visibility into your cloud applications and network infrastructure. SolarWinds Observability Self-Hosted (formerly known as Hybrid Cloud Observability) stands out for its automated discovery, application alerting, intelligent mapping, historical and real-time dashboards, and seamless integration with monitoring systems. The tool also integrates seamlessly with monitoring systems like AppOptics™ and Security Observability to provide users with increased visibility across the IT infrastructure.
Finally, SolarWinds Observability Self-Hosted (formerly known as Hybrid Cloud Observability) has customizable reporting and an intelligent AIOps called SolarWinds AIOps, which makes it easy to monitor and track inbound connections across your application stack.
2. SolarWinds Observability SaaS (formerly known as SolarWinds Observability) (30 Days Free Trial)
©2024 SolarWinds Worldwide, LLC. All rights reserved.
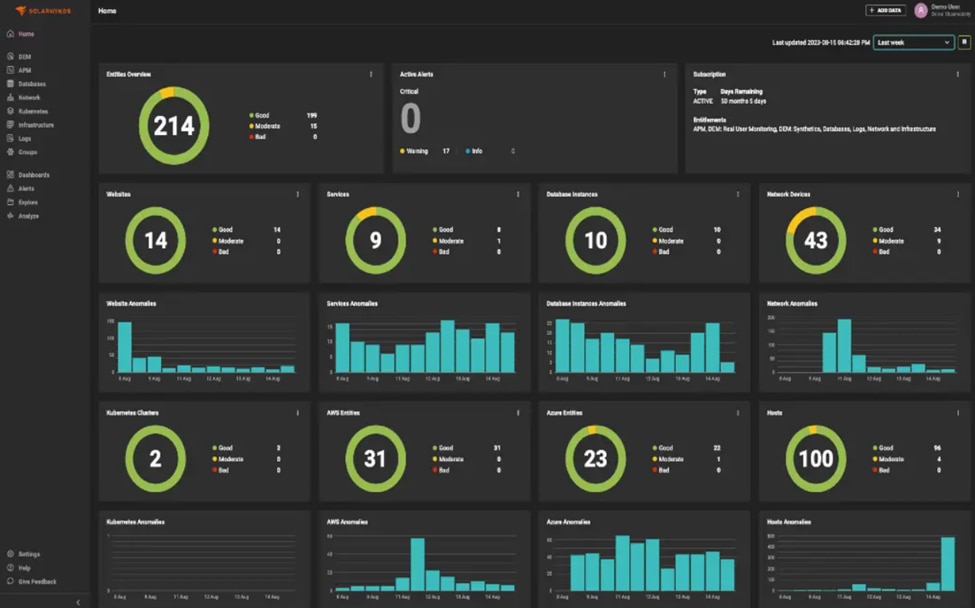
SolarWinds Observability SaaS (formerly known as SolarWinds Observability) is a SaaS platform offering users visibility and a unified, comprehensive snapshot of their cloud-native, on-premises, and hybrid custom infrastructures. The functionality of this solution extends beyond a typical observability platform. This product’s ability to offer full-stack, multi-source log management, AIOps enhanced observability, and monitoring across multiple environments makes it distinctive. It also provides monitoring for networks, web applications, websites, logs, Kubernetes, real users, nodes, java, PHP performance, and Python. SolarWinds Observability SaaS (formerly known as SolarWinds Observability) also integrates and seamlessly supports various databases, channels, applications, and languages.
Last but not least, SolarWinds Observability SaaS (formerly known as SolarWinds Observability) AIOps can help you proactively address issues and streamline the management of your distributed environments, all within its user-friendly interface.
3. Dynatrace
© 2024 Dynatrace LLC. All rights reserved.
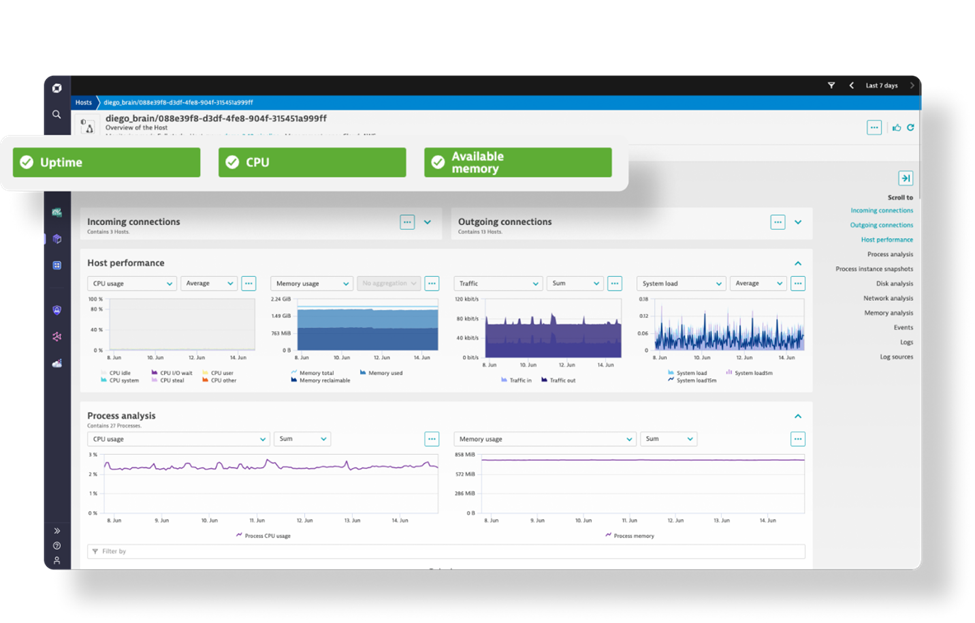
Dynatrace is an end-to-end AI-powered data and network infrastructure observability platform for modern multi-cloud environments. This platform provides complete visibility into your IT environment with detailed metrics and access to over six hundred third-party technologies, SDKs, and plugins.
Since causal AI powers Dynatrace, you can go beyond surface-level analysis and perform root-cause analysis more efficiently and securely. In addition, the platform allows users to comprehensively view their virtualized network infrastructure and quickly identify any changes. Dynatrace also supports cloud automation, open ingestion, and digital experience monitoring.
4. Datadog
© Datadog 2024
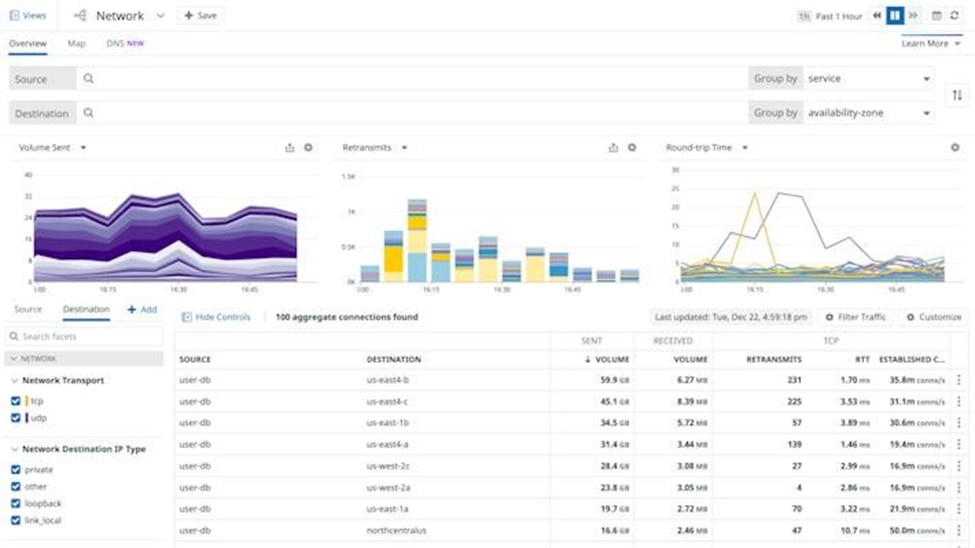
Datadog is a modern monitoring and observability platform that offers network and traditional application performance monitoring. One of its biggest selling points is offering your team a unified real-time infrastructure, network, and application performance monitoring platform. Besides having the ability to act on real-time network insights, the platform also has support for over five hundred built-in third-party integrations.
Other notable and interesting features include the ability to analyze DNS performance without having to SSH into individual machines and analyze traffic to managed cloud services. You can assess DNS server health with request volume, response time, and error-code metrics. These features and capabilities help businesses keep an eye on their networks and fix problems before they affect their customers.
5. Kentik
Copyright © 2024 Kentik. All rights reserved.
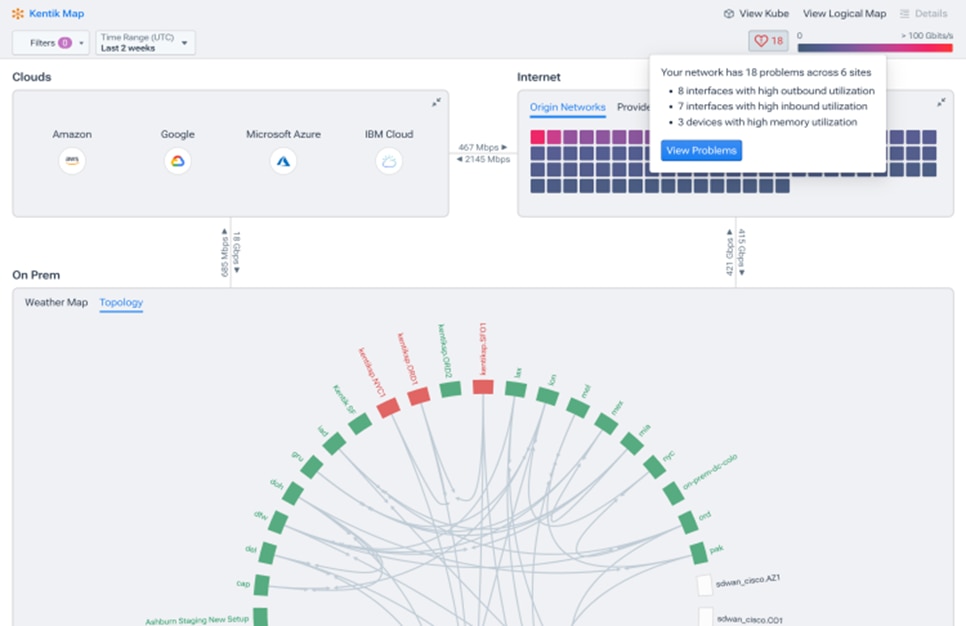
Kentik gives enterprises the ability to provide comprehensive network observability across all multi-cloud deployments and the ability to have real-time visibility into the network environment. In addition to functioning as a centralized portal that gives users visibility into their network traffic and flow, Kentik also includes a REST API that allows it to integrate seamlessly with third-party applications.
This SaaS solution’s key features include network diagnosis and complete multi-cloud and hybrid cloud network visibility, spanning on-premises and containerized environments. Kentik also offers other features, such as synthetic monitoring to test network performance under controlled conditions, connectivity cost optimization for cost savings, and network performance monitoring to track the health of network infrastructure. These features let businesses get AI-driven insights, proactively address performance bottlenecks, avoid security vulnerabilities, and improve user experiences.
Summary
Network observability has become increasingly important in recent years due to the ever-changing network landscape and the complexity of modern networking configurations and architectures. It’s essential to gain visibility into complex networks, optimize performance, and meet business goals.
To take the next step, choose an observability solution like SolarWinds Observability SaaS (formerly known as SolarWinds Observability). It provides everything you need to gain visibility across your complex network environment. Observability is all about pinpointing issues and proactively automating fixes to remediate them.
This post was written by Ifeanyi Benedict Iheagwara. Ifeanyi is a data analyst and Power Platform developer who is passionate about technical writing, contributing to open source organizations, and building communities. Ifeanyi writes about machine learning, data science, and DevOps and enjoys contributing to open-source projects and the global ecosystem in any capacity.
Leave a Reply