As networked environments continue to become larger, more global, and more distributed, many organizations have higher benchmarks for what they expect from their IT infrastructure. Companies want systems capable of adapting to hardware changes, support machine virtualization, and run applications across disparate data centers. But to ensure these complex IT environments are healthy, companies need infrastructure monitoring tools with visibility into key performance metrics.
Infrastructure monitoring tools collect data from hardware, applications, servers, and other network components. They track metrics like CPU and memory usage, uptime, and response time. These tools create a log of actionable intelligence IT departments can use to drive decision making about resource provisioning, troubleshooting, and capacity planning.
Why Is Infrastructure Monitoring Important?
The foundation of any IT infrastructure can be boiled down to a few essential elements: equipment, policies, and processes. Infrastructure monitoring gives IT teams the ability to track and manage how these elements are functioning with the systems environment. With better data collection, you can increase the operational efficiency of processes and reduce downtime.
Infrastructure monitoring can also help your organization meet service level agreements (SLAs). IT departments set SLAs regarding the level of performance they can expect from the devices, networks, servers, and resources they use. These contracts stipulate service level objectives (SLOs), or the specific acceptable and target thresholds for metrics like device capacity, responsiveness, and uptime. You must monitor these metrics if you want ongoing insight into your service levels.
How Does Infrastructure Monitoring Work?
Infrastructure monitoring tracks performance metrics across a range of devices within the system environment. Individually and together, these metrics help you understand the health and functioning of your environment.
Hosts, or individual machines, are important to monitor for CPU and disk space usage, as this provides information about the total resources available and in use for applications and other services. Server monitoring software also lets you track web server performance, which has a direct effect on how customers interact with your web applications—every second adds up, so ensuring downtime is kept to a minimum will help keep satisfaction high. Monitoring also helps with processes like database performance tuning, identifying network bottlenecks and routing issues, and ensuring network load is optimally balanced.
Infrastructure monitoring provides system-wide insights into health, performance, and potential issues, which helps create a more reliable computing experience overall. For better insights, start with these five top tools for infrastructure monitoring:
SolarWinds AppOptics

The SolarWinds® AppOptics™ solution provides comprehensive infrastructure monitoring and web app analytics for platforms and systems of all sizes, regardless of whether they’re host-, cloud-, or hybrid-based. This monitoring tool allows you to see how your entire infrastructure is running from one screen. Out of the box, AppOptics features more than 150 plugins and integrations—including ones for Amazon AWS and Microsoft Azure—and lets you track metrics and analytics for databases, web servers, hosts, containers, load balancers, and more.
Real-time visibility and color-coded graphs make it easy to quickly identify chokepoints and underperforming devices. The robust alerting system can be configured to keep you informed as devices and processes approach or exceed performance thresholds, allowing you to act swiftly to prevent issues from escalating. Because AppOptics collects and centralizes performance data, you’re also able to go from birds-eye-view charts to examining specific log files associated with host devices with just a few clicks.
ipMonitor
© 2020 SolarWinds Worldwide, LLC. All rights reserved.
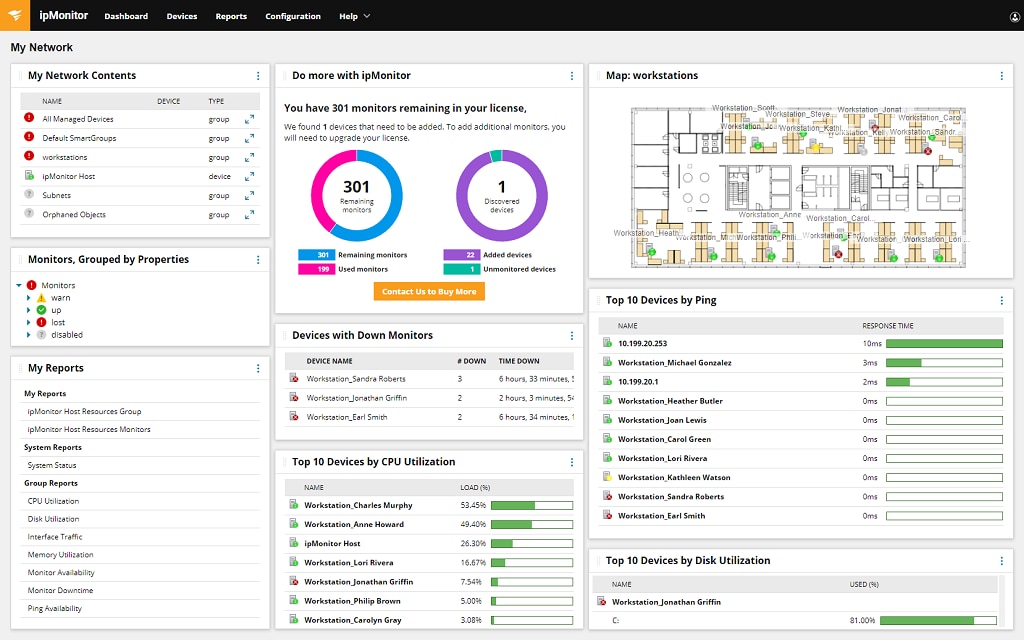
Network, server, VMware® host, and application monitoring can be challenging without the right tools. From the initial setup and network discovery stages to the continued process of tracking key data and metrics, the process can be onerous, and completely overwhelming at first. When you need to get insights into your network and infrastructure fast, in a user-friendly form, there’s a great solution available – SolarWinds® ipMonitor®.
ipMonitor can help you get started with network, server, and applications monitoring as soon as possible. It can be installed in minutes on almost any device you may have at your disposal. The tool’s Startup Wizard is built to make it easy to get started, with features to guide you through the processes of automated device discovery and custom alert configuration. Once ipMonitor is installed, it can connect to a vast array of devices across your network and can begin performing a comprehensive set of tests to identify any potential problems within your network. If any issues are detected, the tool’s robust alerting system will let you know right away, providing insight into the issue type and pointing you to the right place to start troubleshooting.
Fortunately, ipMonitor is specifically designed to be user-friendly, which is why the tool makes it easy to see the most relevant data quickly in the interface. ipMonitor is built to collect and display the most relevant metrics on its intuitive console, then lets you drill down into greater detail for any data indicating a problem. The tool also pinpoints issues capable of interfering with network performance, including problems with resources like bandwidth hogs and bottlenecks.
SolarWinds ipMonitor comes with a free, fully functional 14-day trial, so there’s no reason not to get started with ipMonitor today. You can test out the tool to see if it’s a good fit for your IT monitoring needs.
Nagios Core
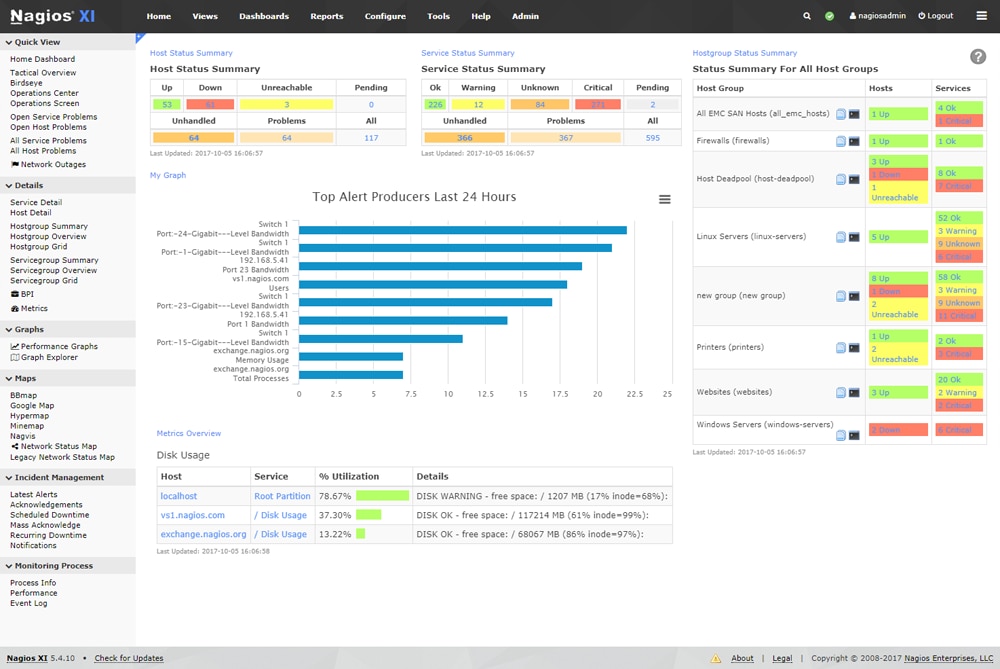
Like AppOptics, this open-source infrastructure monitoring solution’s dashboards provide a centralized view of system infrastructure. This tool offers real-time monitoring for every host and service within the network. Nagios is available as a source install script and is lightweight to install.
This platform includes customizable alerts, though it relies on a text-box configuration to run. Nagios comes with many free add-ons, so you can shape the tool to fit the needs of your infrastructure. Its active online user community provides a wide-reaching knowledge base about troubleshooting issues with the application or with various performance metrics.
Zabbix
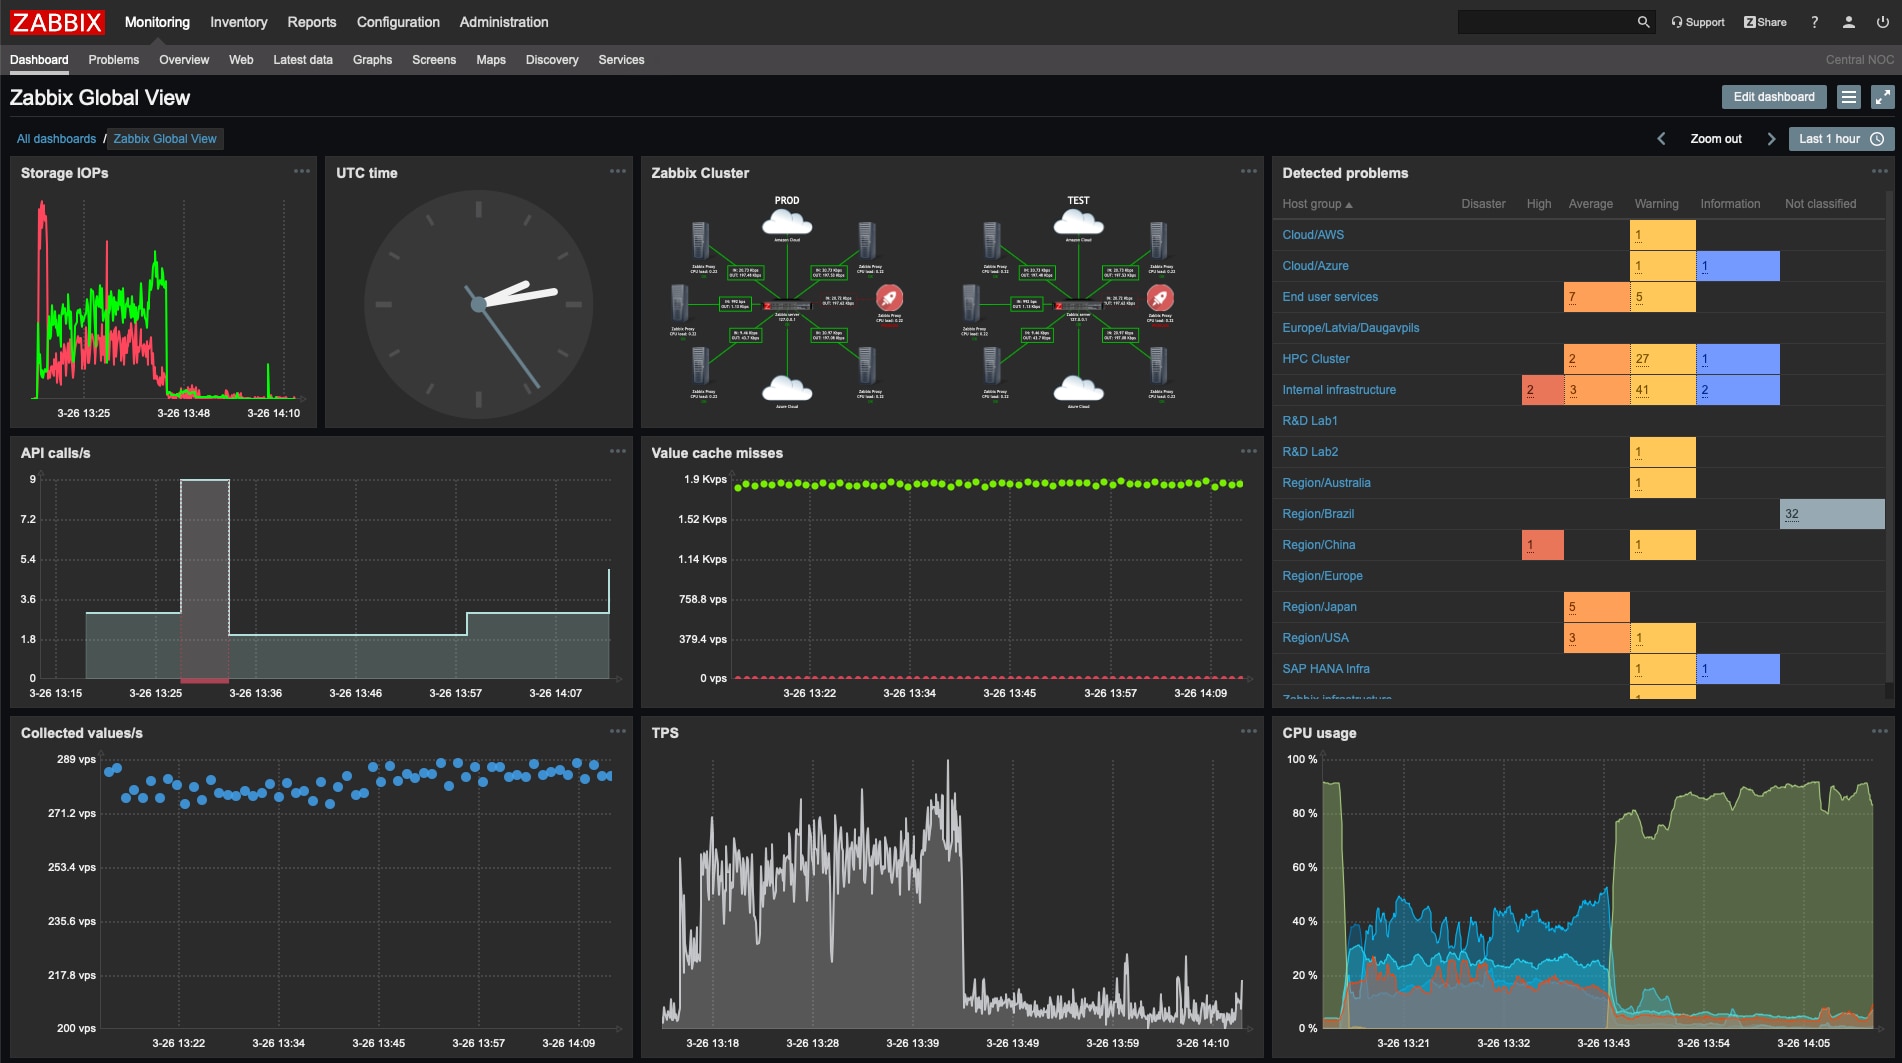
Another open-source tool, Zabbix can monitor performance and availability for servers, applications, databases, and networked devices. One difference between Zabbix and Nagios is that Zabbix includes a medley of baked-in integrations and features.
Zabbix uses server-agent architecture, can be configured online to monitor Linux, macOS, and Windows operating systems, and allows for script automation in different languages, including Java, Python, Ruby, and Perl. It includes the ability to integrate with other system management tools. This monitoring solution is scalable and offers autodiscovery, which is useful for large networks.
Icinga
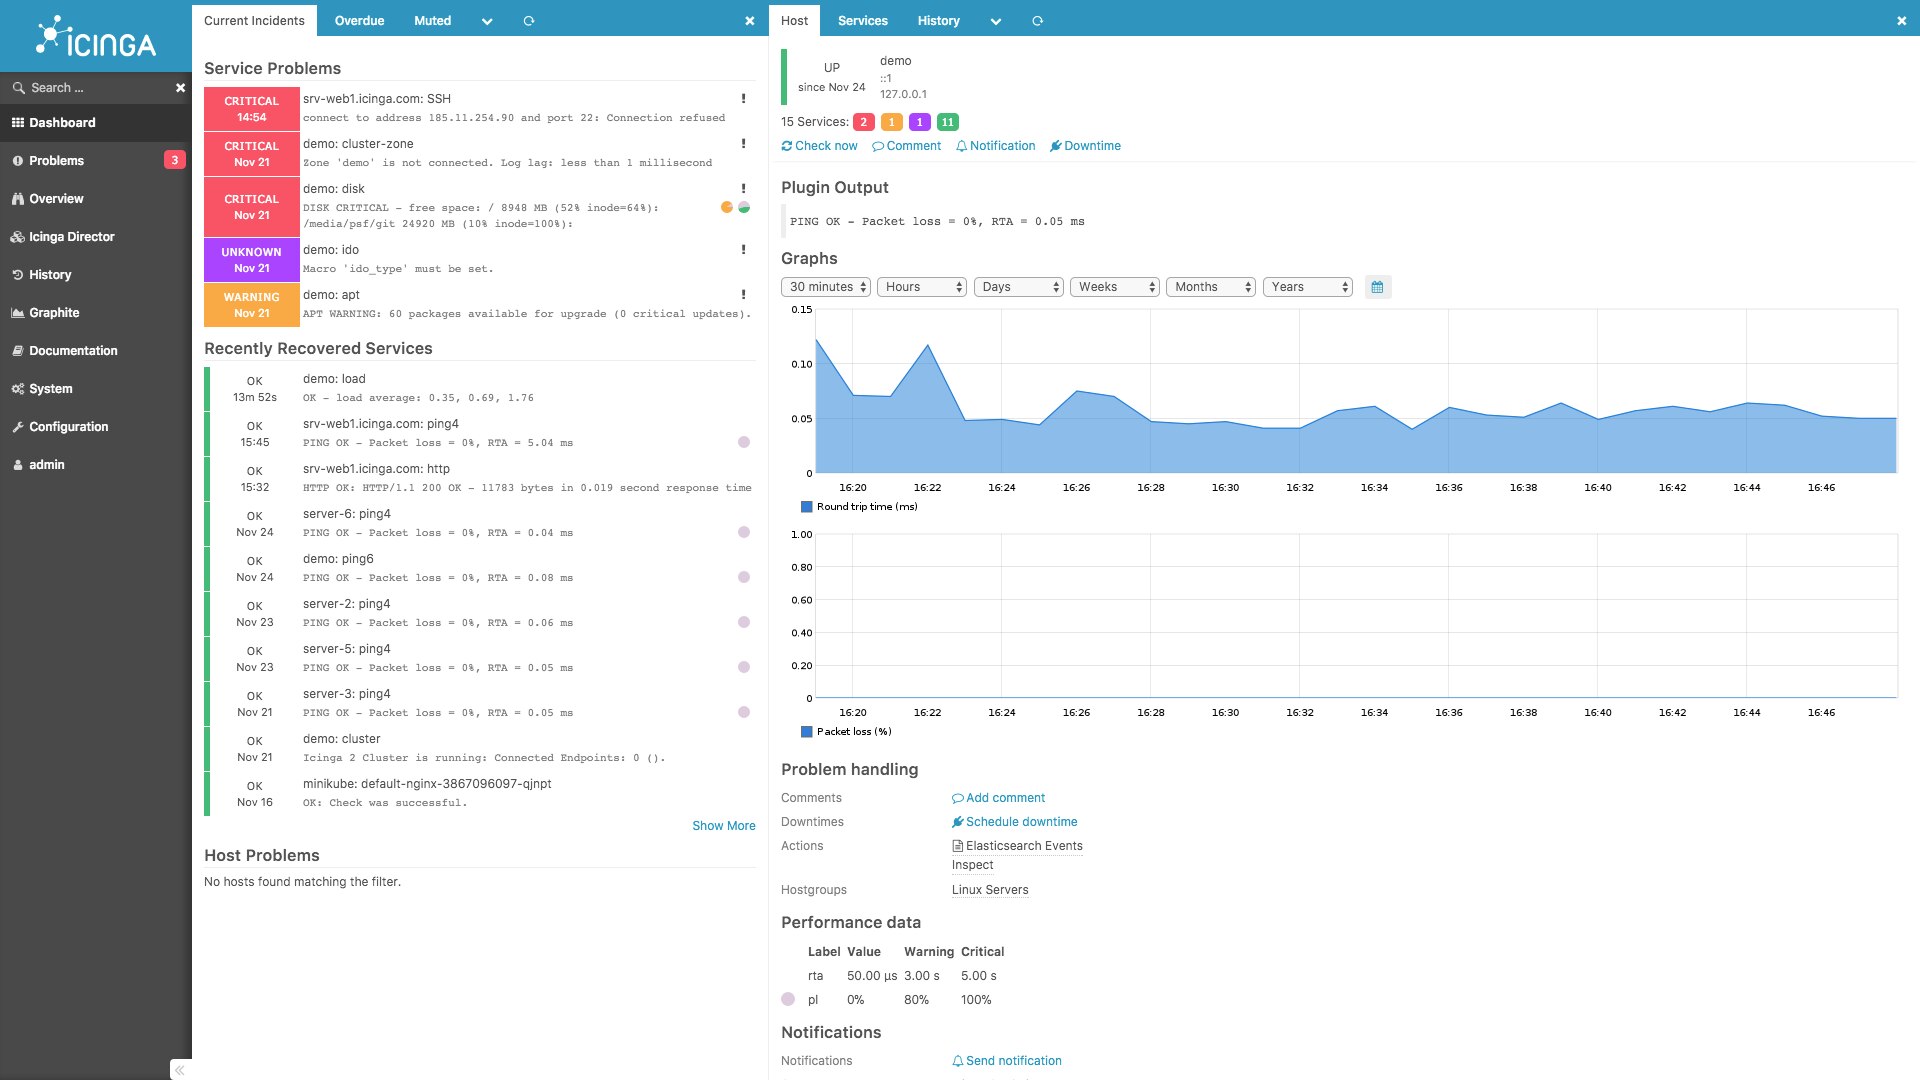
Originally an offshoot of Nagios, Icinga was designed for easier configuration, scalability, and speed. It offers much of the same features as the other options here, including quick installation, an alerting system, and customizable dashboards to suit your requirements.
Icinga uses the same text-based configuration files as Nagios, but the publisher provides detailed how-to documentation on its site, allowing users to take full advantage of this infrastructure monitoring tool’s core monitoring tools. Once up and running, Icinga provides monitoring for entire data systems and features proprietary modules for vSphere, certificate monitoring, and process modeling.
Prometheus
This open-source monitoring solution is built primarily for gathering and analyzing time-series data, with specific built-in tools making it appropriate for monitoring Kubernetes and other containerized environments.
Prometheus uses SNMP pings to collect performance data from devices across the network, which it then uses to produce visualizations like plots, charts, and tables. Users can then navigate through the interface to find the information they need. Or you can use the alert manager to set up notifications to send whenever the application detects a qualifying event. You can customize these notifications on a user-by-user basis.
Built to be scalable, Prometheus features baked-in integrations enabling you to stay on top of network workload, regardless of the system size. If you have questions while using the tool, you can refer to its community following.