Monitoring the speed and uptime of your website is a must for all website owners. Not only will it help you understand the experience your visitors receive on your website, it will also enable you to quickly fix any issues on your site and make informed long-term performance improvements.
In this article, we look at five top website speed and availability tests and services to give you insight into your site’s performance. Each tool tests and reports slightly different metrics and data, so by the end of the article, you should have a good understanding of which tests best suit your needs.
1. Pingdom Website Speed Test
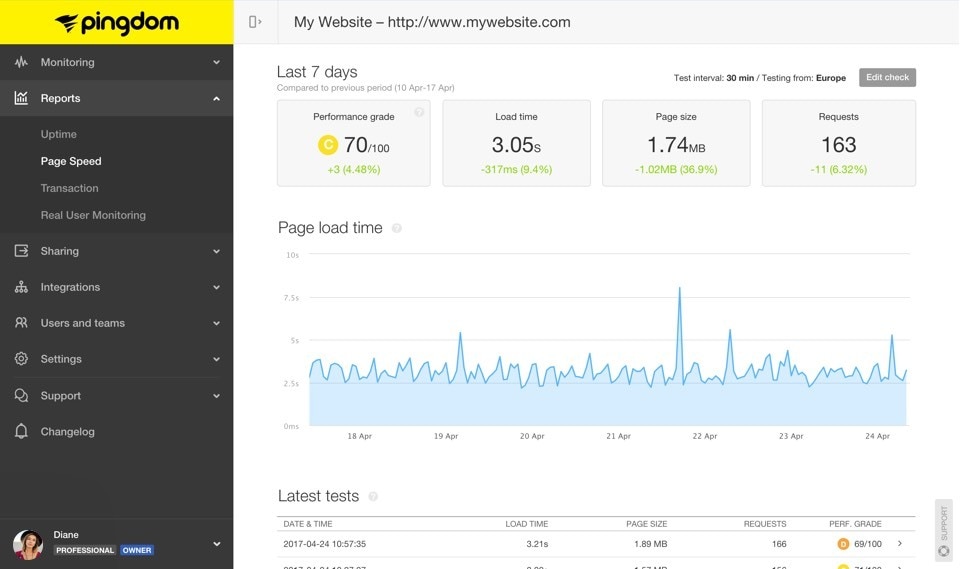
SolarWinds® Pingdom® is an online monitoring tool with a range of performance-related tests and tracking options. Specifically, the free Pingdom website speed test will help you analyze your website’s loading time and identify issues potentially affecting its speed.
To test your website, enter your site’s URL into the Pingdom website speed tool. You can then choose to test from seven different data centers around the world, including North America, South America, Europe, Asia, and Australia. By tracking your site from different locations, you’ll get a clear picture of the loading times your users receive in their various regions.
Analyzing the Data
Once Pingdom has run the test, it gives you an in-depth report of how your website is performing. Key metrics reported include:
- Performance grade
- Page load time
- Page size
The Pingdom performance grades for this free website speed test are based on the best practice recommendations from Google PageSpeed Insights. Using the performance grade data, Pingdom will then list specific site improvements you should make to help increase site speed. For example, recommendations could include making fewer HTTP requests, or compressing site components with gzip.
Pingdom also reports in greater detail on page size and load times. Reports include:
- Content size—Pingdom breaks your page content down into specific elements and reports their size (e.g., image, script, font, CSS, and HTML size). With this information, you can see which elements are causing page bloat and need optimizing.
- Number of requests—Again, Pingdom breaks page content into individual elements (image, script, font, etc.) and then reports on the number of requests required by each to render the page. If you find components showing a high percentage of requests, then you need to look at ways to reduce these numbers, for example by combining multiple scripts into one script or using CSS sprites.
- Waterfall chart of file requests—Pingdom waterfall analysis of file requests is invaluable data for any website owner or developer who wants to dig a bit deeper into a site’s performance. This chart displays all the individual loading requests on your page, helping highlight aspects of slow performance and providing you with data-driven insight into what elements need optimizing.
Pingdom also offers a premium version of its service, which includes around-the-clock uptime and transaction monitoring and alerts, website speed analysis over time, real user monitoring, and more.
2. Dotcom Tools

Created by Dotcom-Monitor, Dotcom Tools is another useful monitoring tool to help you understand how your website is performing. Dotcom Tools is a free speed test tool which gives you a couple of options over the metrics you test.
• Location—Test your website from over 25 data centers located across the globe.
• Browser—Test via Firefox, Chrome, Internet Explorer, or a selection of mobile web browsers.
Like Pingdom, by selecting different server locations and browsers, you can analyze how your on-site user experience differs.
Analyzing the Data
The data and reports presented once you’ve run the tests with Dotcom Tools isn’t as well presented or easy to interpret as Pingdom. That said, test results include:
• Load speed—Dotcom reports first time page speed and repeat load times for your website.
• Page size—In addition to an overall page size, Dotcom also shares your fastest and slowest elements.
• Waterfall chart—Dotcom displays a waterfall chart, giving you a visual interpretation of how the page is loading, including the times and sizes for each component.
3. Load Impact

Load Impact offers a slightly different performance related test, which will be of interest to those who want to check out how their website and/or hosting provider copes under pressure.
The free Load Impact tool will test your website over a period of three minutes. During that time virtual users will access your website, starting at just one and building up to 25, while Load Impact records the loading times. This will give you a clear picture of how your site’s performance is affected as traffic increases.
Analyzing the Data
Load Impact presents the data in a performance overview graph, tracking both the number of virtual users and your site’s response times. This helps you clearly see any correlations between the number of visitors accessing your website and its load times.
If your site’s loading times are significantly slowing as user numbers increase, then you’ll need to investigate this issue further. Load Impact also analyzes the test results and checks for any performance issues or bottlenecks occurring during the loading process.
For anyone running a website with higher volumes of traffic than 25 simultaneous visitors, Load Impact’s premium packages allow you to run tests with up to 100 virtual users over a 15 minute period.
4. Pagelocity
Pagelocity is another useful webpage speed testing tool, but with the added extra of also focusing on SEO. Metrics reported on come under three main headings:
• On-page SEO
• Performance
• Code insights
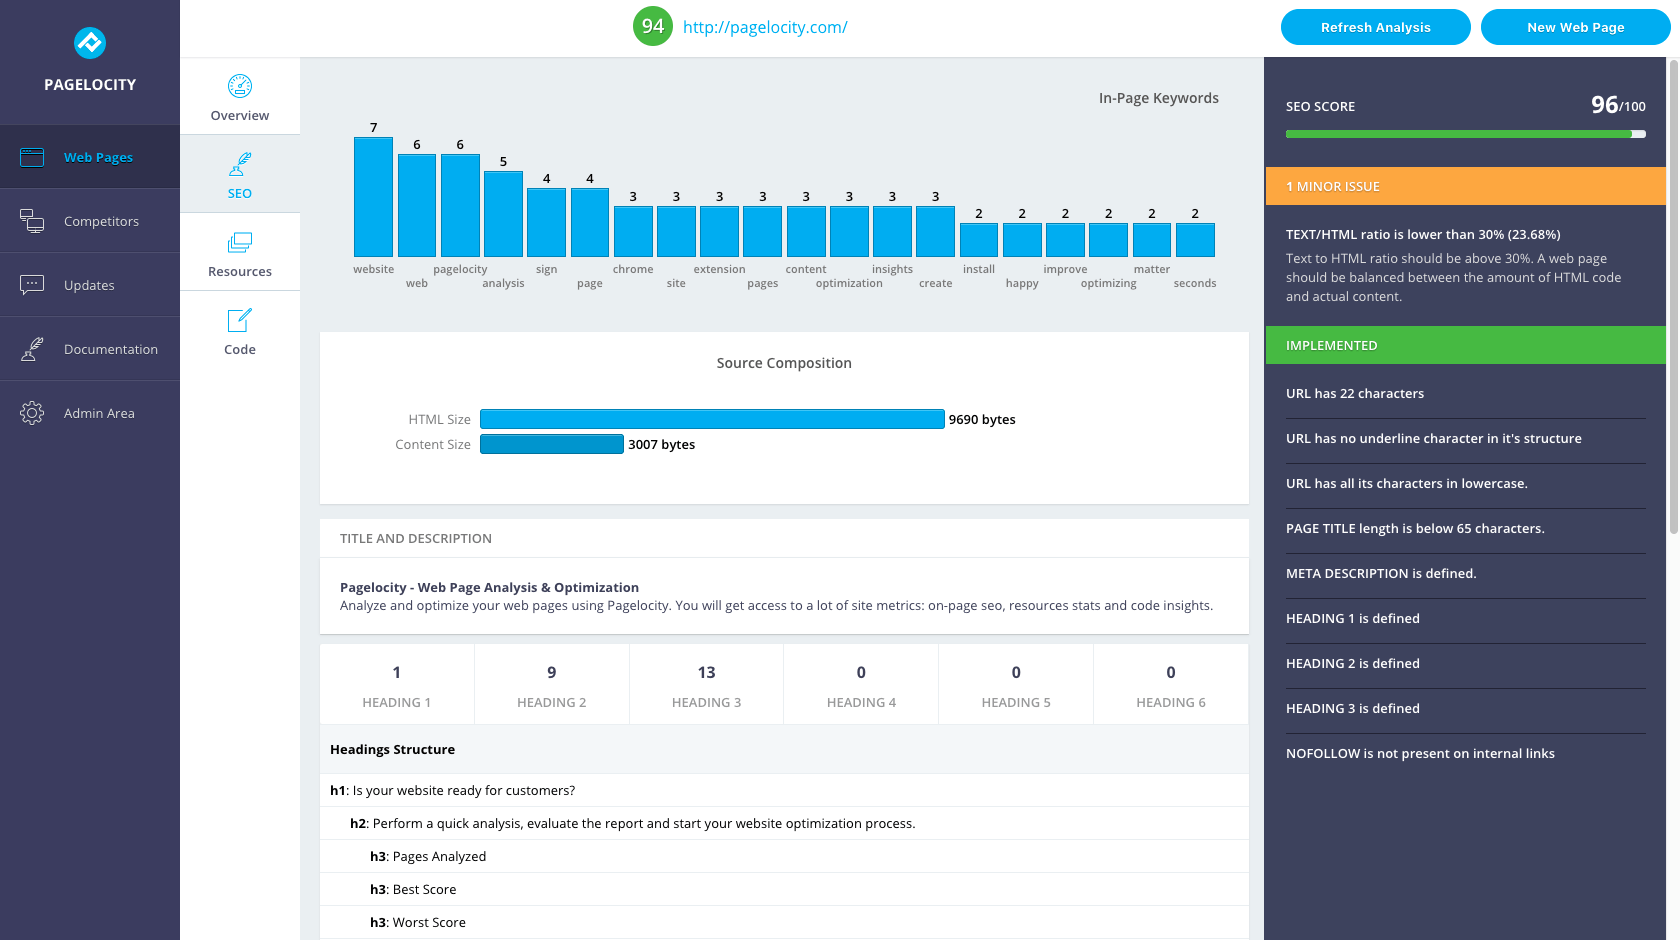
Each category is given a score out of 100, and Pagelocity then breaks down the score, highlighting any minor and critical issues and explaining what your site is doing right.
Analyzing the Data
Pagelocity runs a complete content audit, providing insights on key words, headings, and internal and external links. It then reports on key metrics like source size, text size, text to HTML ratio, and more. Importantly, it gives you guidelines on how to improve your site’s SEO, for example, using the H2 (heading 2) tag or shortening your page title.
For performance, Pagelocity reports on image, script, and CSS size, and gives a page speed score out of 100. Based on this score, Pagelocity then highlights any issues found and provides recommendations on how to improve your loading times.
5. Yellow Lab Tools
Yellow Lab Tools is the last in this collection of website speed and availability tests. Yellow Lab tests website size, checks for performance-related best practice, audits HTML, CSS, and JS, and more. It also tracks how JavaScript and HTML DOM interact during the page loading process.
Analyzing the Data
Once you’ve run the speed test, Yellow Lab Tools gives your site a performance score out of 100. This score is then further broken down into categories, including:
• Page weight
• Requests
• DOM complexity and manipulations
• jQuery
• CSS complexity
• Web fonts
Yellow Lab also uses color coding to highlight any issues. Although this tool doesn’t give specific page loading times, the information provided gives you a clear understanding of site size and performance. This data can then be used to inform future performance-related improvements.
Final Thoughts on Top Website Speed and Availability Tests
All of the above tools and tests will enable you to gain insight into your site’s performance. Each tool measures and reports different data. However, whichever tests you decide to run and analyze, what’s important is what you do with the findings.
Learn from the test reports and use the data to make informed decisions on future optimization strategies. This will help improve your site’s performance across the board, and ensure your visitors consistently receive fast loading times and an impressive user experience.