Since SQL Server 2008, you can debug SQL code using the existing debugger. To start debugging, choose Debug | Start Debugging in the main menu of SQL Server Management Studio. An example batch will be used here to demonstrate how the debugger works. (A batch is a sequence of SQL statements and procedural extensions that comprises a logical unit and is sent to the Database Engine for execution of all statements included in the batch.)
Figure 1 shows a batch that counts the number of employees working for the p1 project. If the number is 4 or more, the corresponding message is displayed. Otherwise, first and last names of the employees will be printed.
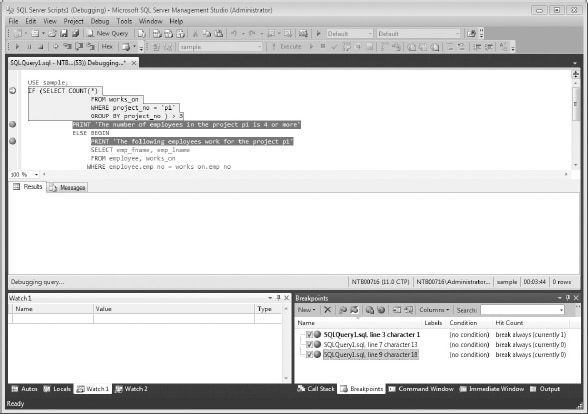
Figure 1. Debugging SQL code
You can set the breakpoints shown in Figure 1 just by clicking in front of the line where the execution process should stop.
At the beginning, the editor shows a yellow arrow to the left of the first line of code. You can move the arrow by choosing Debug | Continue. In that case, all statements up to the first breakpoint are executed, and the yellow arrow moves to that breakpoint.
In debugger mode, SQL Server Management Studio opens two panes, which are placed at the bottom of the editor. All the information concerning the debugging process is displayed in these two panes. Both panes have tabs that you can select to control which set of information is displayed in the pane. The left pane contains Autos, Locals and up to four Watch tabs. The right pane contains Call Stack, Threads, Breakpoints, Command Window, Immediate Window, and Output tabs. For instance, you can use the Locals tab to view values of variables, the Call Stack tab to review the call stack, and the Watch tabs to type (or drag) a part of the code of an SQL expression and to evaluate it. (In Figure 3-13, for instance, the Watch1 tab is activated in the left pane, and the Breakpoints tab is activated in the right pane.)
To end the debugging process, select the blue square icon in the debugging toolbar or choose Debug | Stop Debugging.
SQL Server 2012 enhances the functionality of the SQL Server Management Studio Debugger with several new features. You can now do the following:
- Specify a breakpoint condition A breakpoint condition is an SQL expression whose evaluation determines whether the breakpoint is invoked. To specify a breakpoint condition, right-click the breakpoint glyph and click Condition on the pop-up menu. In the Breakpoint Condition dialog box, enter a Boolean expression and choose either Is True, if you want to break when the expression evaluates to true, or Has Changed, if you want to break, when the value has changed.
- Specify a breakpoint hit count A hit count is a counter that specifies the number of times a breakpoint is reached. If the specified hit count is reached, and any specified breakpoint condition is satisfied, the debugger performs the action specified for the breakpoint. The action could be any of the following:
- Break always (the default action)
- Break when the hit count equals a specified value
- Break when the hit count equals a multiple of a specified value
- Break when the hit count is greater than or equal to a specified value
To specify a hit count, right-click the breakpoint glyph on the Breakpoint window and click Hit Count on the pop-up menu (see Figure 1). In the Breakpoint Hit Count dialog box, select one of the actions from the preceding list. If you need to set the hit count to a value, enter an integer in the text box that appears. Click OK to make the modifications.
- Specify a breakpoint filter A breakpoint filter limits the breakpoint to operating only on specified computers, processes, or threads. To specify a breakpoint filter, choose Breakpoint | Filter. You can then specify the resource that you want to limit in the Breakpoint Filters dialog box. Click OK to make the modifications.
- Specify a breakpoint action A breakpoint When Hit action specifies a custom task that is performed when the breakpoint is invoked. The default action for a breakpoint is to break execution when both the hit count and breakpoint condition have been satisfied. The alternative could be to print a specified message. To specify a breakpoint action, right-click the breakpoint glyph and then click When Hit on the pop-up menu. In the When Breakpoint Is Hit dialog box, select the action you want. Click OK to make the modifications.
- Use the QuickWatch window You can use the QuickWatch window to view the value of a Transact-SQL expression, and then save that expression to a Watch window. (To select the Quick Watch window, choose Debug | Quick Watch.) To select an expression in QuickWatch, either select or enter the name of the expression in the Expression field of the Quick Watch window.
- Use the Quick Info pop-up When you move the cursor over an SQL identifier, the Quick Info pop-up displays the name of the expression and its current value.
Leave a Reply