There are several ways to view SQL Server query plans, but perhaps the easiest is to view the graphical plan using SQL Server Management Studio (SSMS). SSMS makes this extra easy by providing a context-sensitive menu option that enables you to highlight any piece of T-SQL in a query window and display the estimated execution plan, as shown in Figure 1 below.
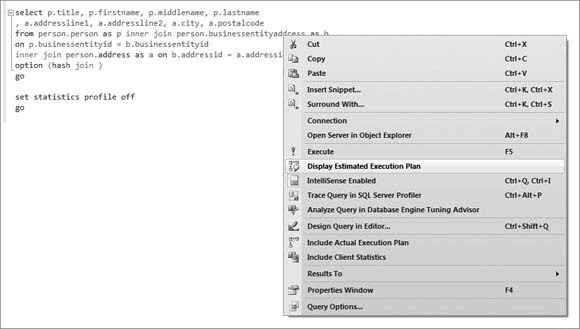
Figure 1.
This provided the output shown in Figure 2.
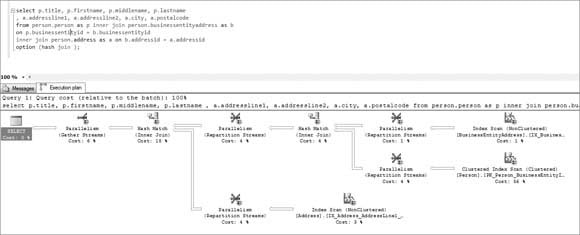
Figure 2.
You can also include SET statements with your query to enable several options that provide additional output displaying the query plan for you. These options are SHOWPLAN_TEXT and SHOWPLAN_ALL. The following code example demonstrates how to use these options:
Use AdventureWorks2012
go
set showplan_text on
go
select * from person.person
go
set showplan_text off
go
Following are the two result sets returned by this query. Note that this is the output after setting the query result options to results to text, rather than results to grid:
StmtText
select * from person.person
(1 row(s) affected)
StmtText
|--Clustered Index Scan(OBJECT:([AdventureWorks2012].[Person].[Person]
.[PK_Person_BusinessEntityID]))
(1 row(s) affected)
Use AdventureWorks2012
go
set showplan_all on
go
select * from person.person
go
set showplan_all off
go
Some of the output columns from this query are shown in Figure 3.
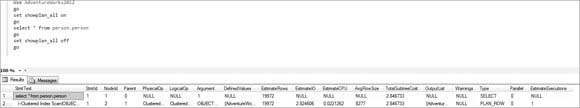
Figure 3.
You can also use SHOWPLAN_XML to get the plan in an XML format:
Use AdventureWorks2012
go
set showplan_xml on
go
select * from person.person
go
set showplan_xml off
go
The results from the preceding query are shown in Figure 4.
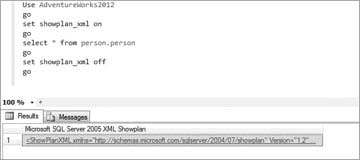
Figure 4.
Clicking on the XML will display the graphical execution plan shown in Figure 5.
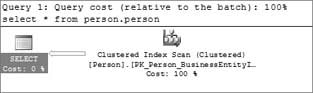
Figure 5.
Another option is STATISTICS PROFILE. This is the first option to be discussed that executes the query, and returns a real plan. The previous options don’t execute the query, they just return an estimated plan. Enabling this option adds statistical information to the showplan. This consists of the actual row count and the number of times each operator was run when the query was executed:
Use AdventureWorks2012
go
set statistics profile on
go
select * from person.person
go
set statistics profile off
go
Some of the columns’ output from this query is shown in Figure 6.
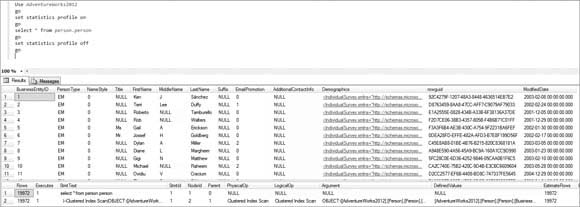
Figure 6.
Another place to look for query plans is in the plan cache itself. When dealing with a lot of queries on a busy production system, it’s often necessary to find the query plan for a particular query that’s currently being used. To do this, use the following T-SQL to return either the XML for the plan or the text of the plan:
Select *
From sys.dm_exec_query_plan(plan_handle)
Select *
From sys.dm_exec_text_query_plan(plan_handle)
Note that you can use two DMFs here: One refers to returning the XML plan; whereas the name of the other implies it will return the text of the plan, suggesting it would be similar to the showplan_text output; but, in fact, both return the XML format of the plan. The difference is that the data type of the query_plan column in one is XML, whereas the data type in the other result set is text.
Leave a Reply