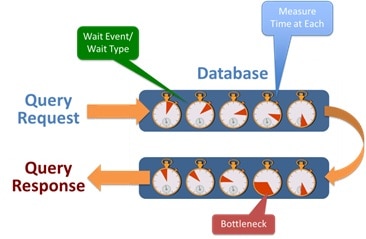
[…] steps in query processing, where a query waits for resources as the instance completes the request. Response time analysis assesses database performance by analyzing time spent at each wait […]
What is Response Time Analysis?
Response time analysis is a more effective approach to improving database performance. It works by focusing DBAs and developers on the most important criteria – what causes applications to wait. Also referred to as wait time analysis, it allows IT teams to align their efforts with service level delivery for IT customers.
The illustration below depicts the Response Time monitoring process. Each SQL query request passes through the database instance. By measuring the time at each step, the total Response Time can be analyzed.

Rather than watching server health statistics and making guesses about their performance impact, wait and response time methods measure the time taken to complete a desired operation. The best implementations break down the time into discrete and individually measurable steps, and identify exactly which steps in which operations cause application delays. Since the database primary mission is to respond with a result, response time is the most important criteria in making database performance decisions.
Response Time = Processing Time + Waiting Time
Response time is defined as the sum of actual processing time and the time as session spends waiting on availability of resources such as a lock, log file or hundreds of other Wait Events or Wait Types. Even when the session has access to the CPU (a CPU Wait Type for example), it is not necessarily being actively processed, since often the CPU is waiting for an I/O or other operation to complete before processing can continue. When multiple sessions compete for the same processing resources, the wait time becomes the most significant component of the actual Response Time.
Wait Events and Wait Types
To accurately measure the Response Time for a database, it is necessary to discretely identify the steps accumulating time. The steps corresponding to physical I/O operations, manipulating buffers, waiting on locks, and all other minute database processes are instrumented by the database vendors. In SQL Server, these steps are called Wait Types. In Oracle, Sybase and DB2, they are referred to as Wait Events. While the specifics are unique for each vendor, the general idea is the same. These Wait Types/Events indicate the amount of time spent while sessions wait for each database resource. If the Wait Types/Events can be accurately monitored and analyzed, the exact bottlenecks and queries causing the delays can be determined.
Response Time vs. Conventional Statistics
Typical database performance monitoring tools focus on server health measures and execution ratios. Even with a sophisticated presentation these statistics do not reflect the end-user experience or reveal where the problem originated. Knowing an operation took place millions of times does not inform whether it was actually the cause of an application delay.
Key criteria to distinguish Response Time vs. Conventional analysis methods:
- Measure response time for an action to take place, from receipt of request to beginning of response.
- Measure each SQL query separately, so the response time effects of a specific SQL can be isolated and evaluated. Measuring total response time across the instance does not give useful information.
- Identify the discrete internal steps (Wait Types/Events) that a SQL query takes as it is processed. Treating the instance as a black-box without seeing where the time is consumed internally does not help problem solving.
Practical Considerations for Response Time Analysis
The Response Time approach to performance monitoring is only practical if it can be implemented efficiently in a performance-sensitive production environment. For example, SolarWinds Database Performance Analyzer uses low-impact agentless technology to meet this requirement.
Here are some practical considerations when evaluating a response time solution:
| Key Considerations | Importance |
|---|---|
| Low Impact Data Capture | Data capturing should not place a burden on your production systems. Agentless architectures offload processing to a separate system that reduces production database impact to less than 1%. |
| Agentless Database Operation | Eliminate need to test, install and maintain software on production servers. |
| Passive Monitoring of Production Data | Monitor real production sessions, not simulated test transactions. |
| Continuous 7/24 Monitoring | Insist on continuous monitoring across all sessions on all servers to ensure any operation can be deeply examined at any time. Occasional trace files will not provide continuous coverage. |
With increased focus on service levels as the most important measure of IT productivity, response time analysis has emerged as the preferred monitoring technique for those customer-focused organizations. Response time analysis tells IT organizations the exact origin of the problem, what impact that problem is having on the end-user, and which organization can best fix it.
This is the exact information (parts verbatim) posted here: http://www.adfontessoftware.com/pg-23917-7-55616/pagina/response_time_analysis.html
Thought you may want to know if others are rebranding your information.