A lot of different factors go into SQL Server® performance, which can make troubleshooting performance problems difficult. However, there are many common SQL Server deployment mistakes that can impact SQL Server performance. In this presentation, you’ll learn about some of the common mistakes that can degrade SQL Server performance and how to avoid them. You’ll also see how SolarWinds® Database Performance Analyzer can help you quickly identify CPU, memory, and storage issues.
Performance is always one of the DBA’s top priorities, and there’s one thing every DBA knows about SQL Server® performance: if there’s a problem you’re going to hear about it. It’s far better to be proactive and stay in top of your system’s performance than it is to be reactive when it comes to addressing user complaints. However, SQL Server is a complex system and getting to the root of performance problems can be difficult. There are a lot of different factors that can impact SQL Server performance, ranging from hardware and system configuration settings to poor T-SQL query practices. In this article, I’ll cover some of the most common causes of SQL Server performance problems and some of the best practices to avoid them.
CPU, Memory, and Storage Configuration
There’s no doubt that server hardware can have a huge impact on performance. This is true whether you are running SQL Server on a VM or if you are running on a physical system. There are three main pillars for SQL Server hardware performance: CPU, memory, and storage. As a rule of thumb, faster processors are always better. However, processor speed has plateaued and CPUs now typically increase processing power by adding more cores. While more cores can definitely help system performance, it is important to realize that not all processes can benefit from multiple cores. For instance, a single threaded process, like many applications, will always only use one core so multiple cores won’t help. If you’re running SQL Server as VM in a server consolidation environment, it’s a good idea not to overcommit the physical cores on the host system. This will help ensure that there’s always available processing power for the SQL Server VMs.
Memory may be the biggest single factor in SQL Server performance. Inadequate memory is one the most common causes of poor query performance. If you’re not using In-Memory OLTP, SQL Server uses its in-memory Buffer Cache to store the results of queries, and it will try to use the results in the buffer to satisfy future queries, foregoing the need to access the much slower disk subsystem. Having adequate memory to grow the Buffer Pool is vital for good SQL Server performance. To check if the system has adequate memory, you can check the following performance counters:
- Memory: Available Bytes – Indicates the amount of available bytes for use by the system. A low value here indicates a shortage of memory.
- Memory: Pages/sec – Indicates the number of pages that were retrieved from the disk due to page faults, as well as the pages written to disk to free space in the working set. A high value here can indicate a lack of memory.
- Buffer Cache Hit Ratio – Indicates the percentage of pages found in the buffer cache without having to read from disk. This ratio should be very high, typically above 90%. A lower value can indicate a lack of memory.
While adding RAM will speed up performance, if the system is memory-constrained it’s important to realize that adding RAM is not a silver bullet for all performance issues. Adding RAM won’t fix poorly written queries or blocking and locking situations.
Storage also plays a vital role in SQL Server performance, and for many systems today, storage has become the main system bottleneck. Many of today’s tier one server systems have multi-core processors and support very large amounts of memory. Some of the enterprise server platforms support more than 200 cores up to 48TBs of RAM. Connecting these high-powered servers to an older storage subsystem often means the storage can’t keep up with the rest of the system. Some important performance counters for monitoring your storage include:
- PhysicalDisk Object: Avg. Disk Queue Length – Shows the average number of read and write requests that were queued on the physical disk. This number indicates the amount of disk operations that are waiting. If this value frequently exceeds two during peak usage, it could indicate a storage problem.
- PhysicalDisk Object: Avg. Disk Sec/Read and Avg. Disk Sec/Write – Shows the average time a disk reads and writes. Values under 10 ms are usually acceptable. Values higher than 20 ms could indicate a storage problem.
The SQL Server database storage configuration can also play a big part in performance. By default, the SQL Server installation program puts both the data and log files on the system drive. Typically, they are stored in a location like C:\Program Files\Microsoft SQL Server\MSSQL13.MSSQLSERVER\MSSQL\DATA. This is not the best configuration and it will quickly cause I/O contention in all but the most modest workloads. Data files tend to support more read operations with more random access, while transaction logs have a high level of sequential write access. For SANs and HDD storage, a best practice is to move the data and log files onto separate physical drive arrays. If you are using flash storage or SSDs, it might be possible to have both on the same drive, but you need to be sure your Disk Sec/Reads and Write are around 1-2 ms.
BIOS and OS Power Settings
Another not so obvious area that you need to check into is the BIOS and operating system power settings. By default, most systems come with this setting set to balanced, which means that the system will attempt to conserve power by cutting CPU processing speed. The balanced setting can reduce available processing power to about 75% of maximum. This is never what you want for a production SQL Server system. On a physical system, you need to check the actual system BIOS to adjust the power setting. The Windows® Server® operating system also has a power setting that you can access by going to Control Panel, Hardware, Power Options. This will display a dialog like you can see in Figure 1.
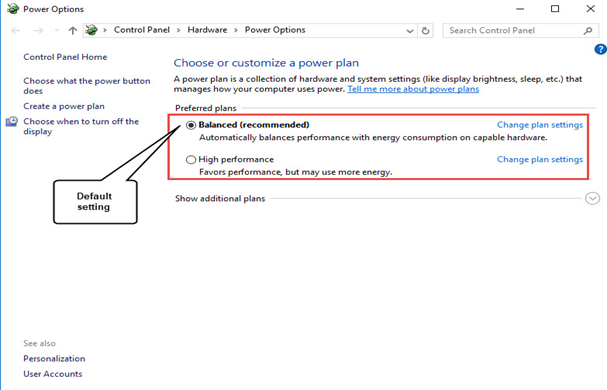
Figure 1 – Windows Server Power Options
©2018 Michael Otey. All rights reserved.
By default, the Windows power plan setting is set to Balanced. To make sure your system is delivering all of the performance it’s capable of, you should change this setting to High performance.
SQL Server TEMPDB and Server Configuration Settings
SQL Server configuration settings can also have a big impact on performance. In the default configuration, several of these settings will result in less than optimum performance. While there are a lot of configuration settings that can influence performance, some of the primary SQL Server default configuration settings that should be considered include:
- TEMPDB – In versions previous to SQL Server 2016, the default setup for tempdb used one data file, which on a busy system would result in I/O contention and high PAGELATCH waits. SQL Server 2016 and 2017 changed this, and now the installation program will prompt you to create multiple data files. The best rule of thumb is to move tempdb onto separate storage from your other databases and use eight data files for the tempdb configuration. Moving tempdb to flash storage can also provide performance benefits.
- Max Server Memory – By default, the Max Server Memory value is 2147483647, which is essentially all of the memory in the system. A best practice is to set this value to 90% of the total system memory leaving 10% or 4GB free (whichever is greater) for use by the operating system.
- Maximum Degree of Parallelism (MAXDOP) – The default setting is 0, which will allow SQL Server to use all available CPUs during query execution. A best practice is to set this value to the number of physical cores in a single CPU.
- Cost Threshold for Parallelism – This value controls when SQL Server should start evaluating plans that can use multiple threads. The default for that value is set to 5. A best practice is to increase this setting to 25-50 depending on the workload. Heavy OLTP use can use a lower value, while heavy OLAP use will benefit from a higher value.
- Instant File Initialization Windows permission – This is a Windows Server setting that controls what happens when you create new databases or grow existing databases. By default, Windows will zero out new space, which takes time. Granting the “Perform volume maintenance tasks” to SQL Server enables it to skip this zeroing-out behavior. SQL Server 2016 and 2017 have the option to enable this permission during installation.
Following some of these best practices for system configuration and setup can help you avoid some of the most common SQL Server performance problems.
Leave a Reply