When you are creating a system benchmark you need a place to store your benchmark data and when you’re collecting SQL Server performance data what better place could there be than SQL Server? Performance Monitor is your primary tool for collecting performance data and Performance Monitor has the capability of writing performance data to SQL Server. That sounds great at first. However, as you get in to this you’ll find that there are a couple of gotchas that you need to be aware of. In this article I’ll guide you through the steps of setting up Performance Monitor to log performance data to SQL Server.
Watch a video summary of this article here:
Creating a Data Collector Set
The first step is to use Performance Monitor to create a User Defined Data Collection which is essentially the collection of performance counters that you want to capture. To create a User Defined Data Collector open Performance Monitor. If you’re running Windows Server 2012 / R2 you can simply type perfmon on the Start screen. Once Performance Monitor is started expand the Data Collector Sets node then right click on the User Defined node and select New, Data Collector Set from the context menu. This will open the Create new Data Collector Set dialog that you can see in Figure 1.
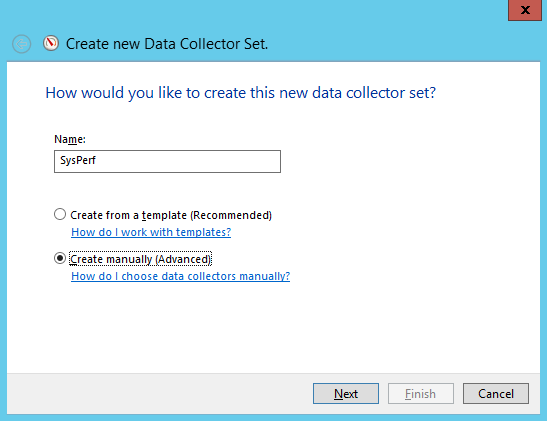
Figure 1 – Create a new data collector set
Give the data collector set a name and select the Create manually (Advanced) option. Click Next and then select the check box for Performance counter then click Next to display the performance counters dialog. Add the different performance counters that you might want to collect. In this example I used the following performance counters.
LogicalDisk:Avg. Disk sec/Read
LogicalDisk:Avg. Disk sec/Write
Memory:Available MBytes
Procesor:% Processor Time
SQLServer:Access Methods:Full Scans/sec
SQLServer:Access Methods:Page Splits/sec
SQLServer:Buffer Manager:Buffer cache hit ratio
SQLServer:Buffer Manager:Free list stalls/sec
SQLServer:SQL Statistics:Batch Requests/sec
SQLServer SQL Statistics:SQL Compilations/sec
SQLServer:Transactions:Free Space in tempdb (KB)
Figure 2 shows the performance counters added to the data collector set.
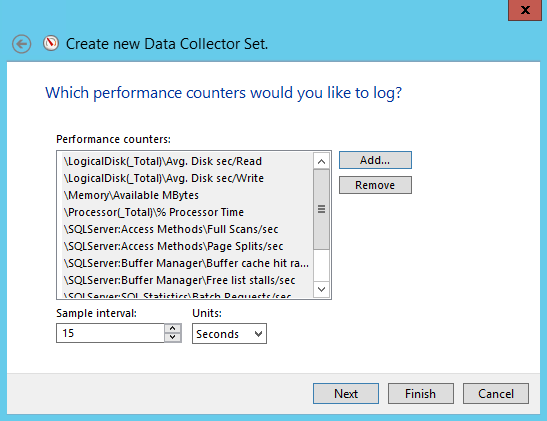
Figure 2 – Add performance counters to the data collector set
Set the Sample interval you want then click Finish. Next, go to SQL Server and create a new database to store your performance data. At this point you’re ready to setup your connection to SQL Server.
Creating an ODBC Data Source for Performance Monitor
First, you need to create a data source. To create data source on Windows Server 2012 / R2 use Server Manager and select the Tool, ODBC Data Sources (64-bit) option (you could also select the ODBC Data Sources (32-bit) option. This will open the ODBC Data Source Administrator. Click the System DSN tab then click the Add button to launch the Create New Data Source dialog that you can see in Figure 3.
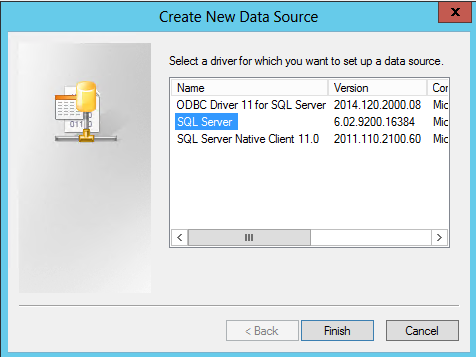
Figure 3 – Selecting the ODBC Driver for a Perfmon data source
Select the SQL Server driver then click Finish. On the next dialog give the data source a name and use the Server dropdown to select the SQL Server instance you want to connect to. Then click Next to display the data source authentication dialog that you can see in Figure 4.
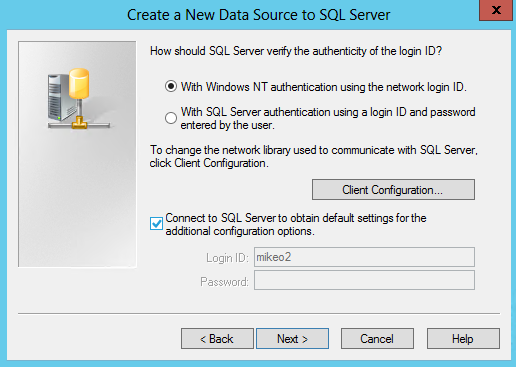
Figure 4 – Selecting Windows NT authentication for the data source
On this dialog it’s vital that you select the With Windows NT authentication using the network login ID. I have never gotten this to work with SQL Server authentication. Then click Next and on the following data source configuration screen use the Change the default database to dropdown to select the SQL Server database that you created earlier. In my example I used a database named SysPerf. Click Finish then OK to create the data source.
Writing the Data Collector Set to SQL Server
After the data source is created go back to Performance Monitor and then in the right pane right click the name of the data collector set that you created earlier and select Properties from the context menu. This will display the Performance Counters tab that you can see in Figure 5.
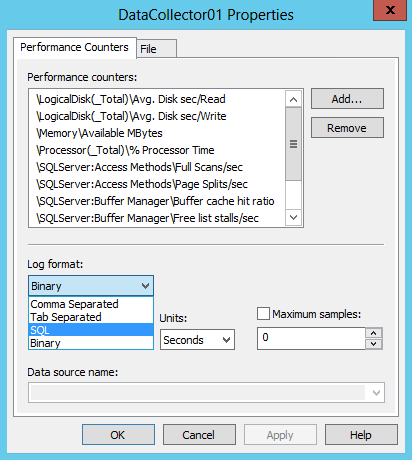
Figure 5 – Selecting SQL Server for the log format
In the Log format drop down select SQL. Then in the Data source name dropdown select the name of the data source that you created earlier.
Next, you need to change the account the Perfmon run under. By default Perfmon runs under the SYSTEM account which doesn’t have a SQL Server login. Therefore you’ll need to change the account that the data collector set uses. Expand the Data Collector Sets node that’s displayed in the left pane followed by the User Defined node. Then right click on the Data Collector that you created and select Properties from the context menu. This will display the Properties dialog like the one you can see in Figure 6.
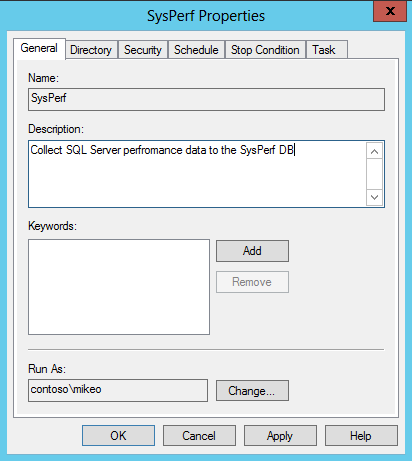
Figure 6 – Change the Data Collector’s Run As property to a SQL Server account
Initially the Run As box will display the value SYSTEM. Click the Change button then enter a domain count that has the appropriate rights to login to SQL Server and update that database that you created for your Perfmon data collection.
This is all there is to do. The tricky parts are using the ODBC driver and then being sure to select Windows NT authentication. After this you’ll will be able to start your user defined data collector. It will log data to your database in three tables: CounterData, CounterDetails and DisplayToID.
Hi,
I was reviewing this article, and found to be useful for sharing with beginners who want to learn on Monitoring. Is there any article that shows how to render the data captured in SQL Server and show in either SSRS or any other reporting tool?
Any information would be helpful.
Thanks,
Sunil.