Updated: 9/29/2022 12:41 PM
If your business relies on Windows Server, you need to make sure the server’s performance supports end user needs, so it’s critical to monitor and optimize your Windows Server environment. For continuous insight into your Windows Server, you must actively monitor elements in your environment, such as the server’s operations, availability, security, performance, and other processes.
The monitoring and optimization process is meant to help you mitigate problems as they arise and ensure the server is performing as you expect. You can understand whether your server’s resources and settings are appropriate and sufficient for supporting business functions. You can then tune the server to fix or avoid common problems, like bottlenecks and overutilization, that cause disruptive downtime.
Choosing a Windows Server Optimization Tool
While important, Windows Server monitoring isn’t necessarily easy. Infrastructure monitoring involves a range of tasks, like protecting web servers from external threats, tracking storage capacity, and checking applications for responsiveness. While some elements of monitoring can be performed manually, it’s more efficient to use automated server performance software. A software solution can provide real-time, continuous insight into your Windows Server environment metrics, making it easier to take corrective action and quickly tune your infrastructure for optimized performance. To get started with monitoring your Windows Server, consider the five following server performance software tools.
1. SolarWinds® Server & Application Monitor (SAM)
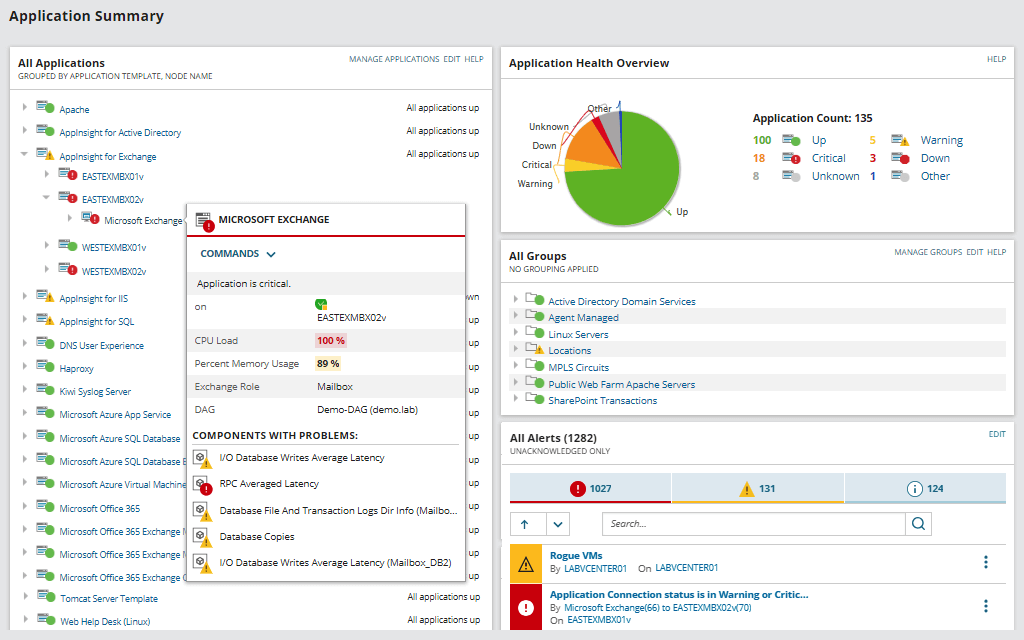
Slow applications and downtime can impact your end users and business services. SolarWinds® Server & Application Monitor (SAM) can not only help with Windows server monitoring, but it can also keep application problems from affecting your day-to-day operations. With the capability to monitor over 1,500 applications, including comprehensive monitoring for Microsoft applications, systems, hypervisors, IaaS, PaaS, and SaaS products, SAM helps you quickly pinpoint the root causes of application issues across various layers of the IT stack. Additionally, SAM agent and agentless deployment can be extended to monitor IaaS environments, such as Azure and AWS, PaaS services for Microsoft Azure, and SaaS services for Office 365. SAM also provides container monitoring for Docker, Kubernetes, and Mesos.
SAM is easy to install and can typically be up and running within an hour out of the box. Once installed, it helps users discover the relationships between applications and servers based on active application communication and can collect network connection statistics, such as packet loss and latency. From there, the SAM easy-to-read, built-in AppStack™ dashboard gives admins an at-a-glance, contextual view of how applications are linked to other components within the IT infrastructure, including servers, VMs, and storage systems. And for quickly addressing performance issues, built-in AppInsight™ monitoring templates were designed to deliver deep visibility to help teams identify complex performance issues in Microsoft Exchange, IIS, and SQL Server. To more quickly identify the root cause of application or other problems, SAM allows for cross-stack IT data correlation—simply drag and drop network performance metrics on a common timeline for immediate visual correlation across your network data.
Another benefit to adopting SAM for Windows server monitoring is it easily integrates with other SolarWinds tools on the SolarWinds Orion® Platform, including Network Performance Monitor, Virtualization Manager, Storage Resource Monitor, and Web Performance Monitor for unified IT monitoring. You can download a free trial and use it as fully functional for 30 days.
2. SolarWinds® AppOptics

AppOptics is a full-service solution for application and infrastructure monitoring designed to provide you with key performance metrics for many system elements, including Windows Server. AppOptics monitors many elements related to your Windows Server, including CPU, memory, disk, and network performance, to help you make configuration changes more quickly and accurately.
With AppOptics you can leverage the SolarWinds Snap Agent plugin, which helps you simplify the work of collecting, processing, and publishing your system data from multiple servers, all using a single API. The powerful AppOptics dashboard visually displays the most current version of this data. The dashboard supports a wide array of metrics related to Windows Server health including disk storage, memory, IO, and CPU. It also lets you create custom parameters for your infrastructure monitoring if you have requirements beyond the out-of-the-box options. The AppOptics dashboard also makes it easier to identify hotspots and resolve bottlenecks by letting you cross-reference your server and infrastructure metrics, so you can mitigate problems before they impact end users.
Beyond its monitoring capabilities, AppOptics comes with powerful alerting capabilities to help ensure the right people are notified as soon as the earliest warning signs of an issue appear. The server performance software lets you set custom thresholds and alerts, so you can be proactively notified whenever any potential issue is detected. This means you can begin addressing Windows Server performance issues as soon as they arise without wasting time searching for the cause.
3. SolarWinds Loggly®
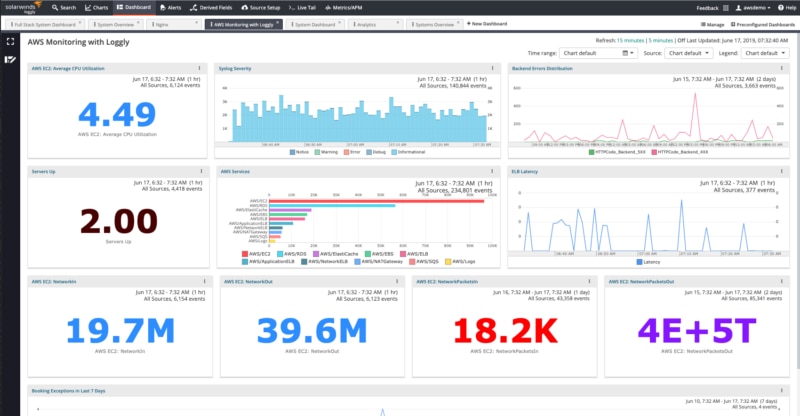
Loggly® is a cloud-based logging solution to help with log aggregation and analysis across servers, cloud-based systems, and applications—including your Windows Server environment. Analyzing log data is a critical element of successful Windows Server monitoring because server logs provide a detailed record of the events within your system and make it possible to troubleshoot problems more quickly.
The Loggly Windows syslog analyzer lets you centralize and process your log data, so you can correlate events and resolve issues. Loggly gathers Windows event logs, syslogs, and other log types, then standardizes the data, so you can compare metrics across your infrastructure. Having all your log data in one place lets you determine whether your servers are performing as expected, see relationships between problems, and drill down into issues with a few clicks.
Loggly offers features to help make log analysis faster. The dynamic field explorer lets you browse through your Windows logs and get quick search results. The surround search feature lets you inspect the events leading up to and following a critical occurrence, providing a more complete picture of the Windows Server issue. And the explorer feature keeps your parsed logs automatically updated, so you always have the most recent logs available.
4. ManageEngine OpManager
Another great tool for Windows server monitoring, especially for small networks, is ManageEngine OpManager. In addition to its Windows server monitoring capabilities, OpManager can monitor a multitude of devices, including storage devices and common hardware and networking components, like switches, routers, firewalls, load balancers, printers, VMs, and other network devices. And while OpManager is first and foremost a network monitoring tool, it also offers capabilities for server management, fault and performance management, storage management, and data center management, along with many additional add-ons designed to be used to expand OpManager’s capacity for other monitoring or management tasks.
The tool provides excellent general server availability monitoring as well as server health monitoring, keeping track of resources critical to servers, such as CPU and memory usage, I/O rate, disk usage, which processes are running, and network performance and connections. Since server performance failures are often due to disk failures, CPU, or memory, these metrics are some of the best indicators of server health. Having ready access to these metrics allows admins to replace faulty components before they fail and affect end users. Aside from continuous Windows server monitoring, OpManager automatically stores all monitoring data, which is valuable for establishing baselines around network and server performance so admins can more easily access and study performance trends, which enables faster troubleshooting and the potential to solve problems before they arise for less downtime and better productivity.
OpManager is also an excellent tool for monitoring VMs. For Windows server monitoring, in particular, it can monitor Microsoft Exchange server performance alongside general Windows services monitoring. If a Windows service is found to have failed, OpManager can remotely restart the service or the entire server if necessary. To quickly and easily address problems the moment they arise, OpManager continuously monitors the processes running on your server, logging details and tracking information. Admins can set customized alert thresholds triggered by network irregularities for multiple servers, including remote servers.
For smaller networks, OpManager offers a free version capable of managing up to three devices. And for larger networks, its Professional and Enterprise editions can monitor up to 1,000 and 10,000 devices, respectively.
5. Netwrix Auditor for Windows Server
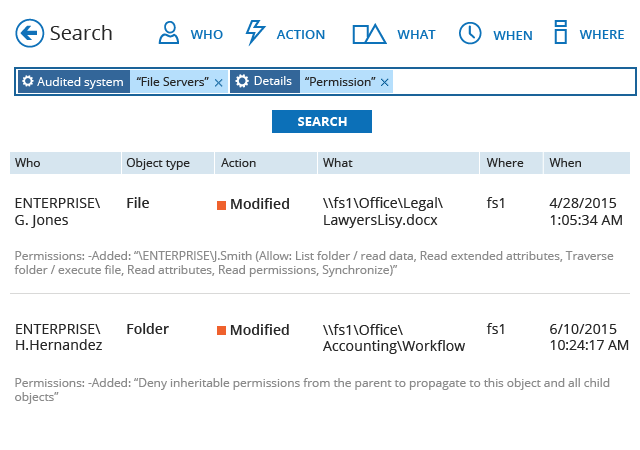
Netwrix Auditor for Windows Server, available as a paid product or free community edition tool, reports on any and all changes made to your server configuration, including changes to software, hardware, the network, DNS, and more. If you want to gain more visibility into server changes, it’s important to use a tool like Netwrix for server configuration monitoring. Automatic visibility into changes can help you protect against both external and internal threats that might otherwise slip under the radar.
Netwrix Auditor gives you both the before and after values for any modifications. Instead of needing to parse through tons of log data manually, you can use Netwrix’s tool to receive automatic daily summaries of activity related to your Windows Server configurations. That way, you do not need to worry about missing any critical changes to Windows Server configurations, file server permissions, or anything else that might open you up to potential threats.
6. Lepide DC Monitor
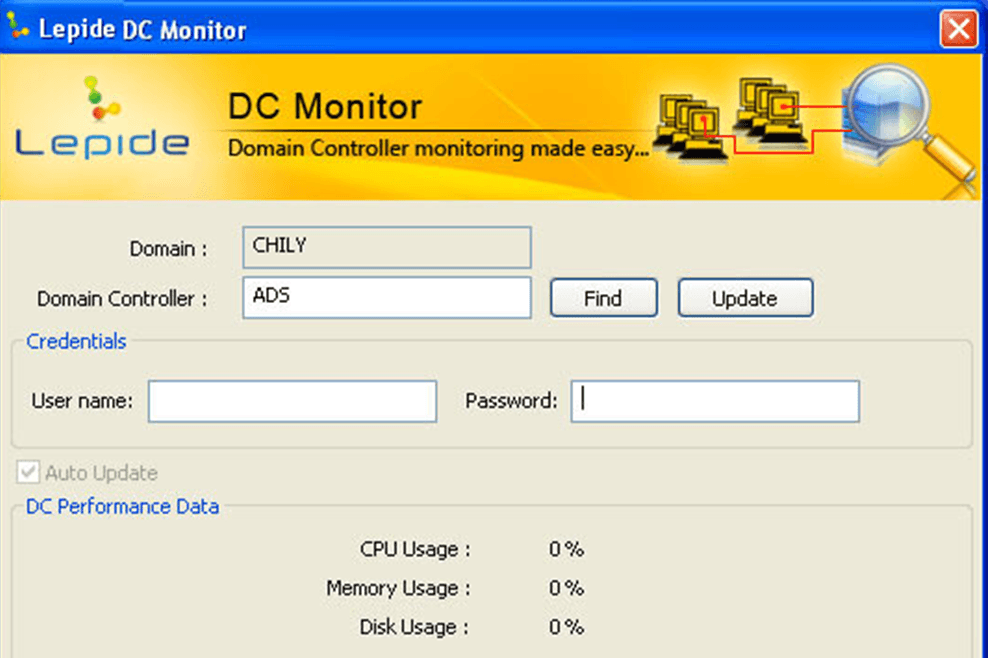
Lepide DC Monitor is a free tool created to simplify the domain controller monitoring process. Domain controllers process authentication requests, making them an important security element of any IT environment. Knowing the state of your domain controller and how it’s performing is a critical element of Windows Server optimization. Lepide DC monitor lets you monitor multiple domain controllers from a single, streamlined interface. The software monitors metrics like CPU, memory, page reads, and disk utilization, making it easier to determine the health and performance of your network’s individual domain controllers. You can then tune your domain controllers to better support an optimized Windows Server environment.
7. Cacti
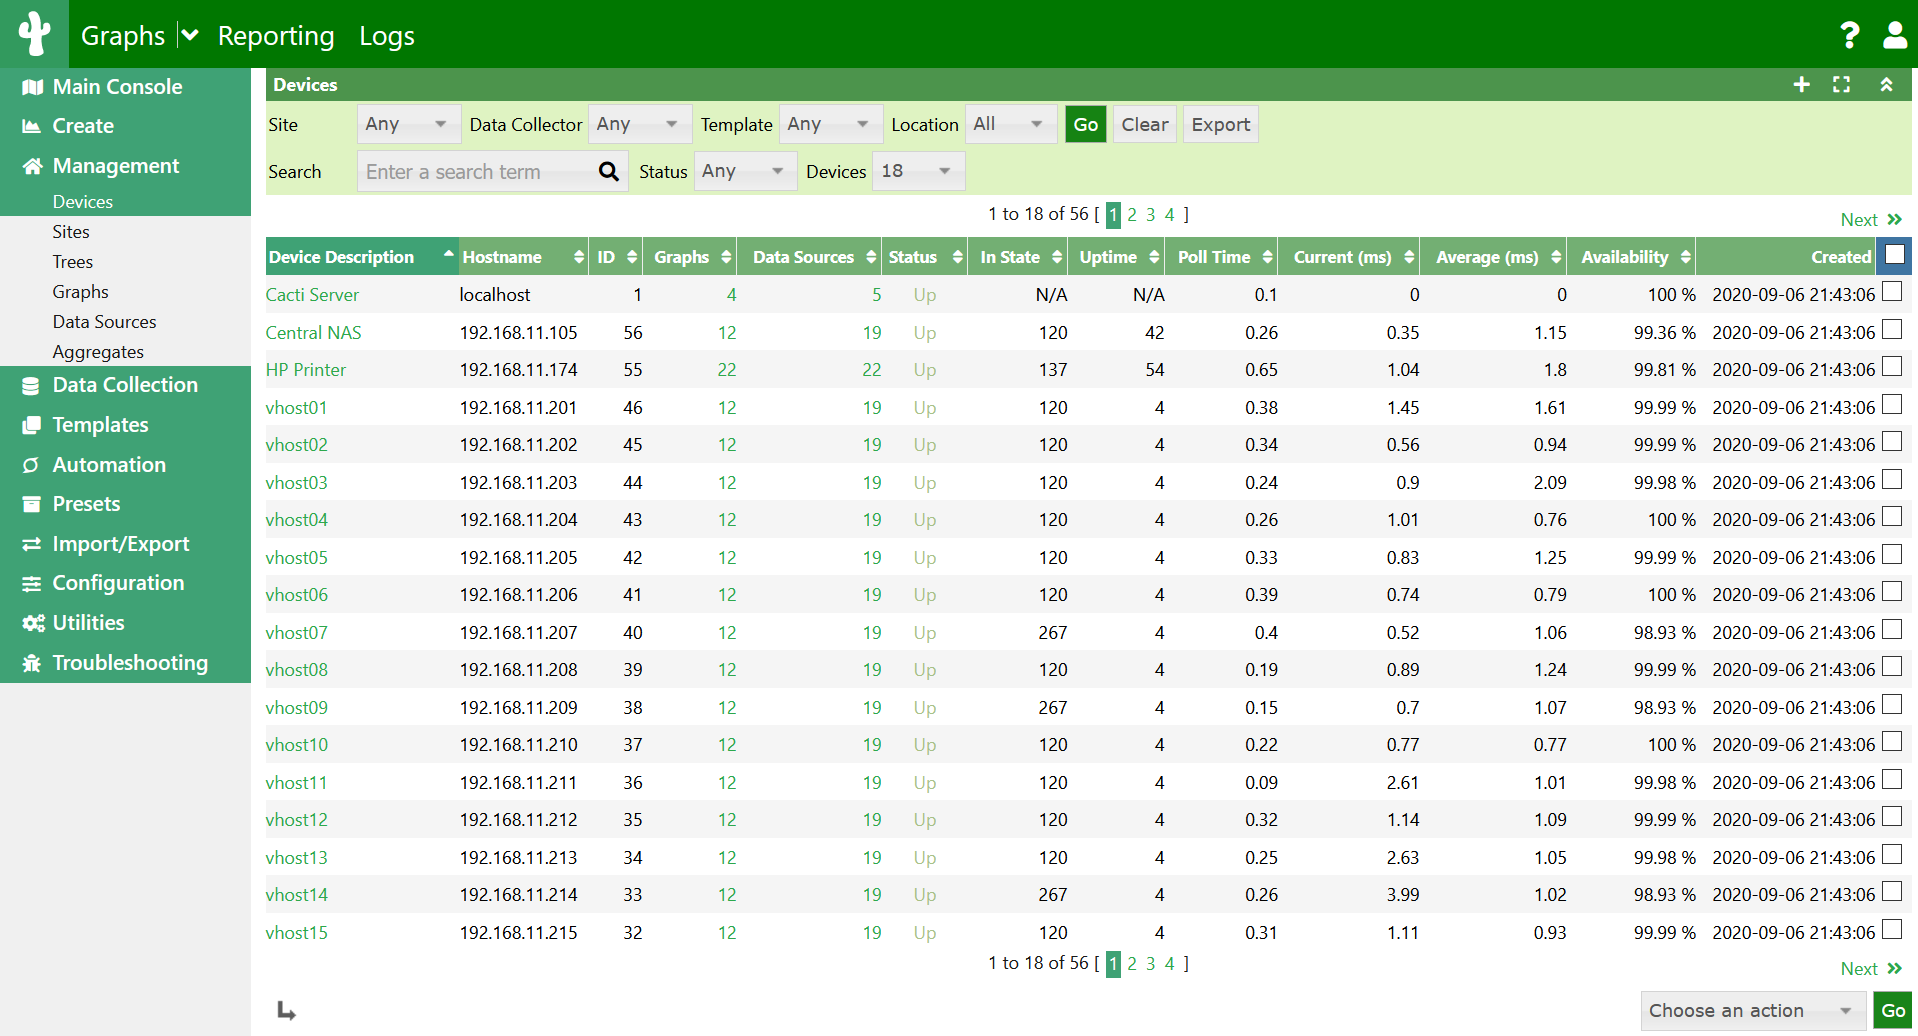
Cacti is a free front-end graphing tool designed to help you visualize the data you collect as part of your Windows Server optimization efforts. Collected data is only useful if you can understand it and use it to improve your Windows Server performance. Cacti can help transform your data from complicated figures into clear displays. Cacti utilizes RRDTool to transform your datasets into a range of customizable graph types. You can collect data for Cacti visualizations from practically any infrastructure element. In addition, you can control who has access to those visualizations because Cacti integrates with user permissions.