How many times you have heard this question: “Why is SQL Server consuming so much memory?” If you ask a DBA who knows the functionality of SQL Server, the answer would be, “That is an expected behavior! Limit max server memory of SQL Server if you are concerned.”
One might then wonder why SQL Server doesn’t release the memory if there is no load on the server. After reading this article, you will have an answer.
SQL Server is a server-based application that is designed for high performance. In SQL Server, the data in table is stored in pages which has fixed size of 8 KB. Whenever there is a need of a page (for read or write) the page is first read from the disk and bought to memory location. This area in SQL Server Memory is called “Buffer Pool”. Once the page is loaded in memory, all subsequent calls which need this page would be read from Buffer Pool – this would avoid disk IO and hence improve performance. This is the precise reason why memory usage in SQL Server is high even if no one is using SQL Server.
Once a page is modified in memory due to data modification (Insert/update/delete), it is called “dirty” page. On the other hand, if a page which is not modified is called “clean” page. Prior to SQL 2005, there was no easy way to find information about pages in buffer pool. From SQL Server 2005 onwards, each data page in buffer pool has one buffer descriptor. Buffer descriptors DMV can uniquely identify each data page that is currently cached in an instance of SQL Server under buffer pool. This DMV sys.dm_os_buffer_descriptors returns cached pages for all user and system databases. This includes pages that are associated with the Resource database which is hidden system database.
Below query can be used to find out how many pages of type clean and dirty for each database.
SELECT (CASE
           WHEN ( [database_id] = 32767 ) THEN 'Resource Database'
           ELSE Db_name (database_id)
         END )  AS 'Database Name',
       Sum(CASE
             WHEN ( [is_modified] = 1 ) THEN 0
             ELSE 1
           END) AS 'Clean Page Count',
		Sum(CASE
             WHEN ( [is_modified] = 1 ) THEN 1
             ELSE 0
           END) AS 'Dirty Page Count'
FROM   sys.dm_os_buffer_descriptors
GROUP  BY database_id
ORDER  BY DB_NAME(database_id);
There is a DBCC command which can drop the clean buffers called as DBCC DROPCLEANBUFFERS. I have run the command two times – before and after DBCC DROPCLEANBUFFERS. Here is what we would see:
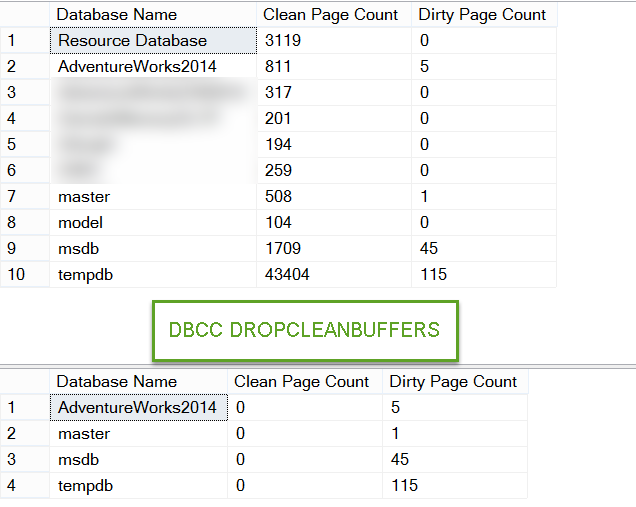
We generally say DROPCLEANBUFFERS as dirty command because we are not supposed to use this on a production server because it would increase disk IO. This is because all pages would be fetched from disk again as they are flushed away from the buffer. In summary, a clean page is one that has not been changed since it was last read from or written to disk. A dirty page has been changed and copy on disk and in memory is different.
Another way to get details about buffer pool is to use performance counters (Perfmon). There is an object called “Buffer Manager.”
How do dirty pages get flushed to disk? Well, that’s the job of checkpoint, which is a background process. The purpose of checkpoint is to flush dirty pages in order to keep the number of transactions that have to be rolled forward during a potential recovery to a minimum.
What if there is a memory pressure? Will clean pages go off the buffer pool automatically? Yes. Lazywriter (again a background process) does that for us. This process flushes out batches of aged buffers. The main purpose of the Lazywriter is to maintain the Free List.
I hope this article has given you a basic understanding of the various components of the buffer pool and the processes needed to maintain enough memory. So the next time you see high memory consumed by SQL, take a deep breath and say – “It’s expected!”
Is there any other way to reduce the memory pressure with out cleaning the Buffer Pool as that command is not recommended ..!!
Yes, the best way to reduce memory pressure is to tune inefficient queries that are reading too much data for the result set that they are returning. You can query the DMV – dm_exec_query_stats which will show you the total_logical_reads, execution_counts and rows_processed for any query that is currently running in your instance. You can also keep an eye out for full table scans or clustered index scans as queries that read too much data often thrash memory so other queries have to go to disk more often.
Can re- org or rebuild index helps in reducing memory pressure …?
Yes, it can for both indexes and tables. Over time, indexes and tables get their data modified (inserts, updates, and deletes). As this happens, when data is removed from pages, those open slots can be reused, but the reuse may not be efficient. This can cause a Swiss cheese effect. Due to this, the database engine will have to read more pages into memory to scan the index or table to find the same amount of data. By doing especially a rebuild, this compresses the data back into an optimum number of pages. This can reduce memory pressure because of the reduced number of pages needing to be parsed to get the data needed. Hope that helps.
We use SQL server 2014 BI (64 bit) in our environment. It is hosted on WIndows Server 2012 R2 with 150 GB of RAM. I have configured the SQL server Max memory to 120 GB. However I see the SQL server buffer pool is utilizing only 64 GB of RAM and reallocating it between databases depending on which stored proc is being executed. Below is the dmv I am using to identify which database is utilizing the bufferpool. I was anticipating to see total buffer pool , while processing data intesive queries, to be equal to max server memory. I am I looking at wrong dmv? if not, what config changes do I need to make to see total data cache in use to be equal to max server memory configured?
SELECT count(*)*8/1024 AS ‘Data Cache Size(MB)’
,CASE database_id
WHEN 32767 THEN ‘RESOURCEDB’
ELSE db_name(database_id)
END AS ‘DatabaseName’
FROM sys.dm_os_buffer_descriptors
GROUP BY db_name(database_id) ,database_id
ORDER BY ‘Data Cache Size(MB)’ DESC