Microsoft has been investing a lot in Azure SQL Database. One of the feature which was introduced in Azure SQL Database was called as Query Store. This feature enables SQL Server to collect the query execution related data continuously in tables. Later, it can be used to see the historical data and solve few of performance issues faced by DBAs. This is available on the latest version of Azure SQL Database V12. This feature would help customer who are deploying continuous fixes for their application code in Azure SQL Database. This feature should help in simplifying performance forensics by reducing the time to diagnose and resolve issues.
Before we get into the nuances of the same, it must be understood that this feature is just not available with the cloud version (Azure SQL Database) but has been neatly rolled into the on-premise latest version of SQL Server 2016. As you see this uniquely tested at scale with the Azure Databases, I am sure you can assume this would be a great asset for your upgrade to SQL Server 2016 too. Let us next get into the specifics and how you can see the same on Azure next.
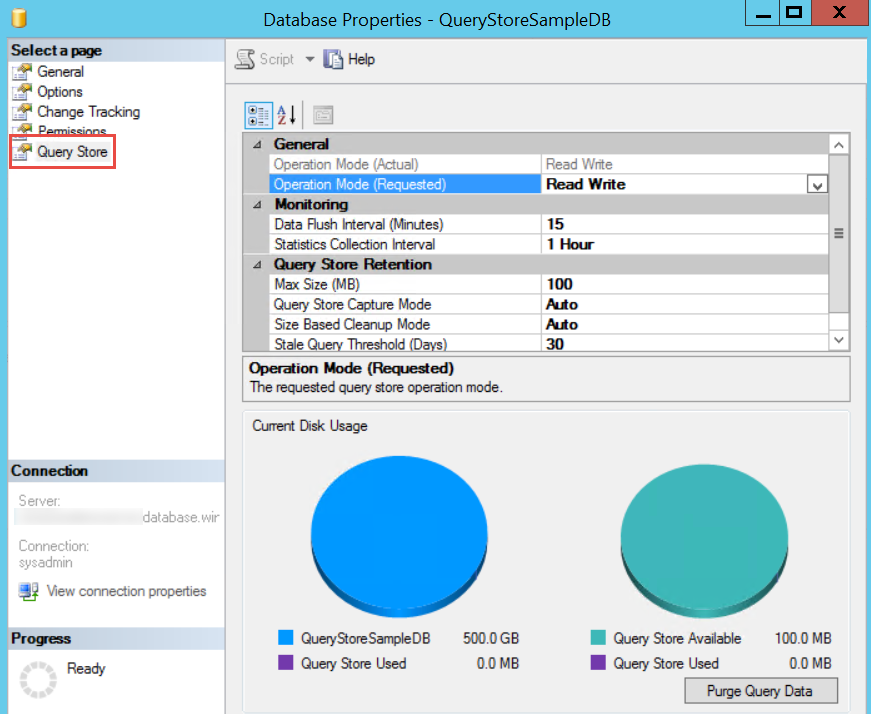
This feature is auto enabled for newly created database in V12. We can change the parameters or disable the feature by right clicking on the database and going to properties.
Above are the default setting which are enabled for a database.
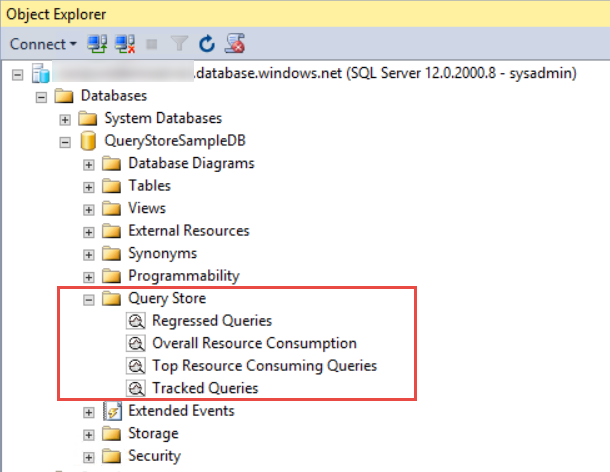
Here is the screenshot taken from SQL Server 2016 Management Studio while connecting to Azure SQL Database.
As highlighted above, we can see new node called Query Store, under which we see below:
- Regressed Queries
- Overall Resource Consumption
- Top Resource Consuming Queries
- Tracked Queries.
All of above report have a configure button on top right corner which can filter the date duration for the report.
Let’s have a look at them one by one.
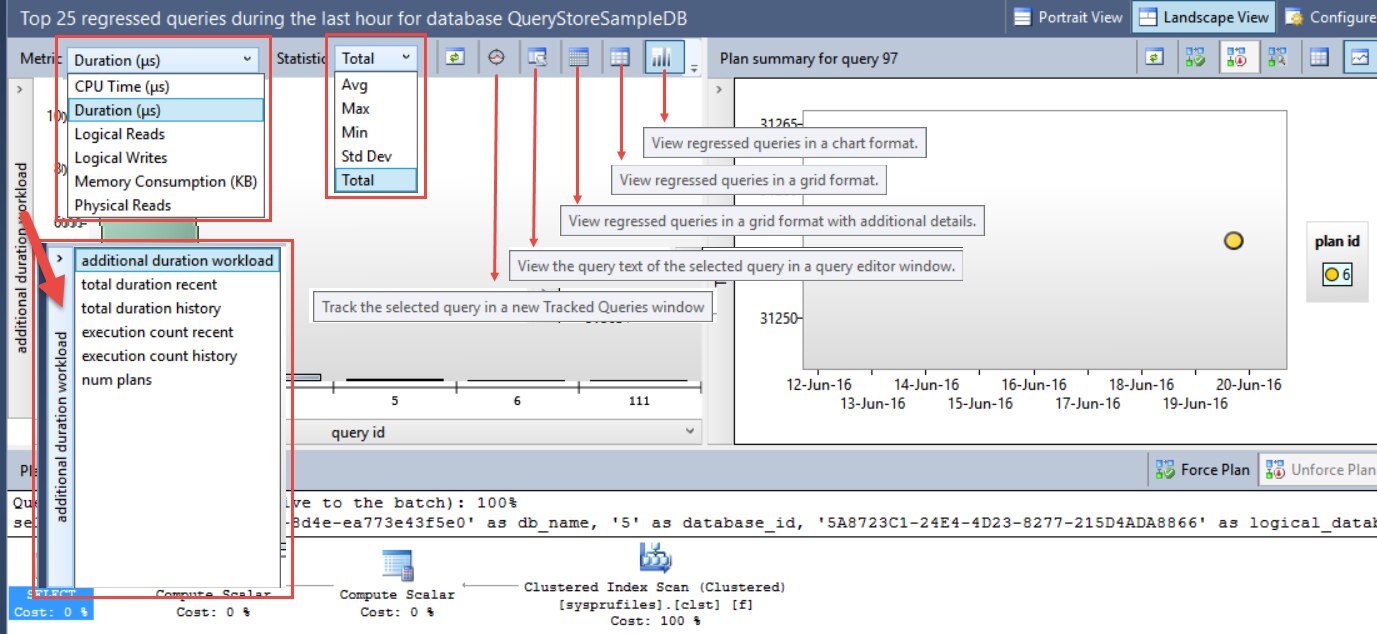
- Regressed Queries: Once we right click on the node then we get options to see the report. Here is the default view. There are various options in the reports which can show different kind of details.
2. Overall Resource Consumption:
This report gives history about all queries and presents them sorted by duration, execution count, CPU time and Reads.
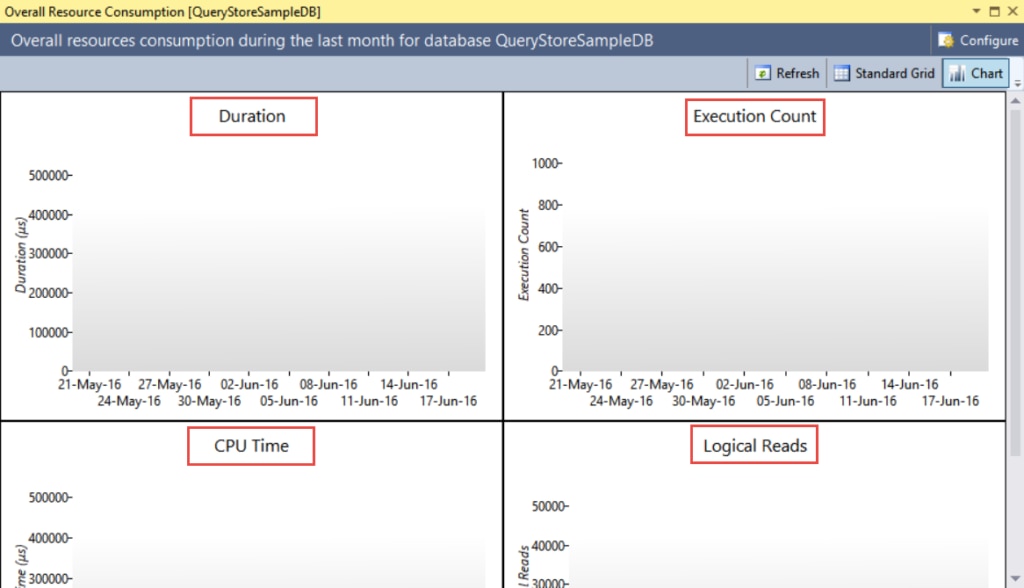 3. Top Resource Consuming Queries
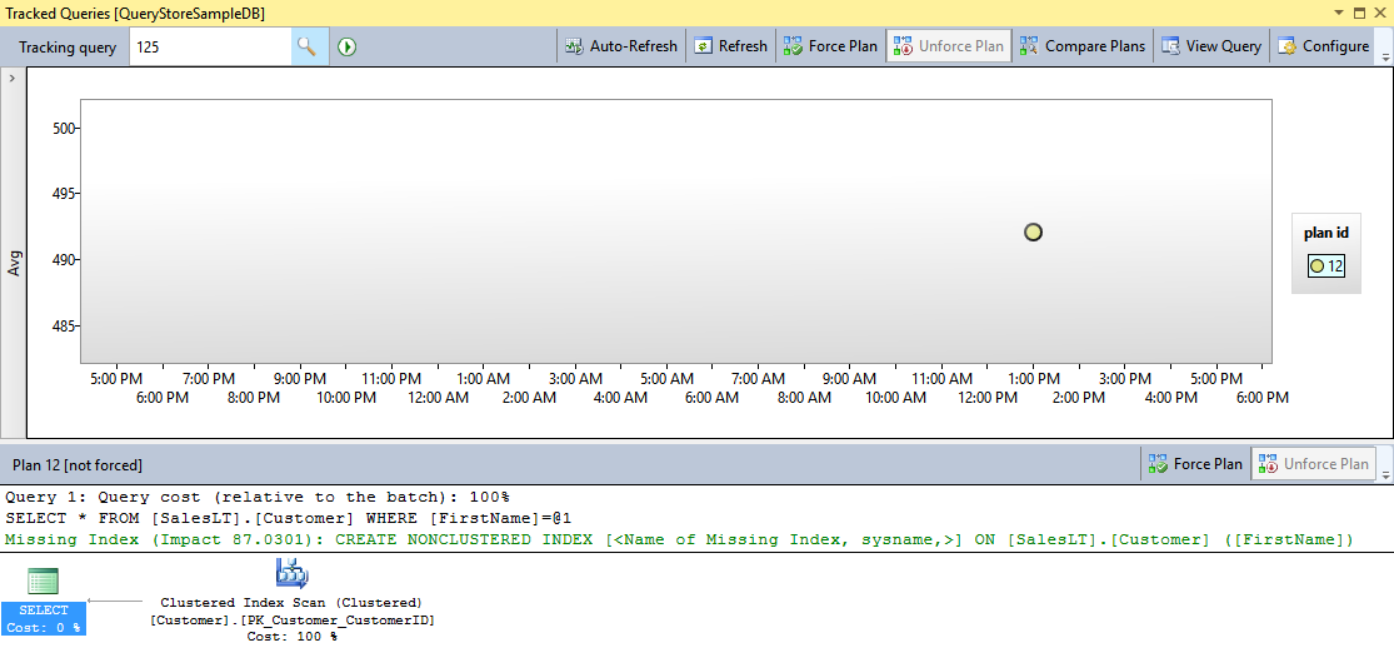
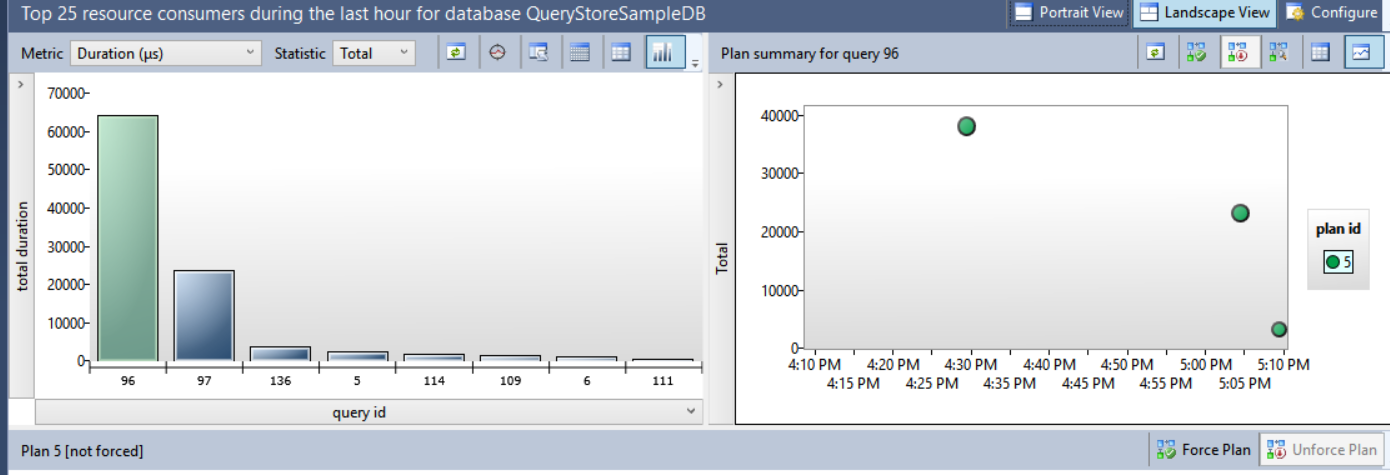 4. Tracked Queries. In earlier reports 1 and 3, there is a button to track a given query. Once tracked, we can see history of that particular query in this report.
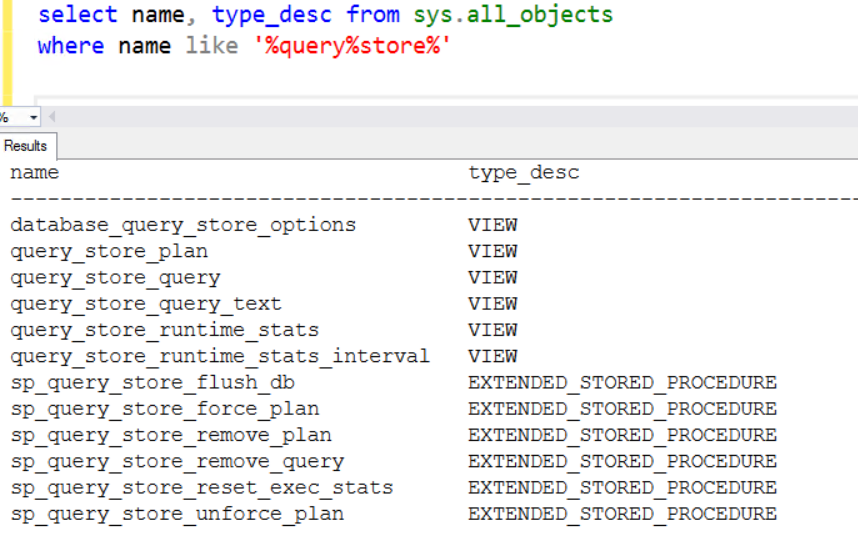
There are T-SQL available to do the same kind of reports. Here are the objects related to query store in the database.
The query store can be considered as two stores; a plan store for keeping the execution plan information, and a run time stats store for keeping the execution statistics information. Both can be used together to fetch the history.
We truly hope that this would help DBAs in spending less time in finding regression and performance tuning. Remember that this is also available with on premise SQL Severer 2016.
Leave a Reply