Like application monitoring, database performance monitoring is a critical discipline. If there isn’t a code issue, there’s a good chance you have a database issue. Key metrics such as CPU and memory usage can give you important insights into your database’s performance. In addition, by monitoring slow queries, and inordinate number of database requests, you can combine this knowledge to optimize both.
Tools like SolarWinds® AppOptics™ can help you measure the performance of your database(s). AppOptics provides real-time monitoring for your database and helps you visualize this data in context of the application and the rest of the infrastructure. AppOptics includes integrations for MySQL, RDS, Cosmos, SQL Server, PostgreSQL, Cassandra, MariaDB, Mongo DB, and Redis databases, plus a couple more.
Interestingly, AppOptics™ also offers database query tracing for a deeper understanding of what’s happening in your database. Such trace requests can reveal problems, including incorrectly configured database indexes which decrease database performance.
Other tool options include SolarWinds® SQL Sentry, allowing database health insights across Microsoft environments, SolarWinds® Database Performance Analyzer, an easy-to-use cross-platform database monitoring tool, and SolarWinds® Database Performance Monitor, a web-based interface for performance monitoring and optimization of several database types.
This article will discuss why it’s worth investing in a database performance monitoring tool and explain four best practices related to the subject.
SolarWinds® Database Performance Analyzer (DPA) is a straightforward tool for cloud and on-premises monitoring of multiple database management system platforms. In general, monitoring applications and IT infrastructure rely on quick database retrieval, efficient queries, and fast database servers to avoid downtime—which means tracking slow queries is one of the most critical components for transitioning from a reactive to a proactive monitoring system. DPA can help you make the switch.
For businesses using multiple database servers, cross-platform database performance monitoring doesn’t have to be complicated. DPA has a unified approach to cross-platform database performance monitoring, with intuitive configuration for multiple servers from a large assortment of vendors, whether on-premises or in the cloud.
With SolarWinds® SQL Sentry, organizations can enable observability to effectively monitor, diagnose, and optimize the entire database environment. A proactive approach with SQL Sentry, leveraging advanced alerting, storage forecasting, and continuous metrics insights, means you’re set up to identify and address database problems quickly. And it helps IT professionals get out of reactive fire-fighting mode while keeping databases running continuously at peak performance.
Bottlenecks can be a significant issue for teams struggling to improve the performance of databases and applications. SolarWinds® Database Performance Monitor (DPM) simplifies tracking the metrics needed to tune databases and reduce network-wide bottlenecks. DPM cloud-based solutions monitor thousands of system-wide metrics at one-second resolution, providing full visibility into the entire database workload. These high-granularity metrics are visualized across an intuitive interface with zoom-in and drill-down capabilities for at-a-glance insight into the root causes of network bottlenecks.
Why Should You Invest in Database Monitoring?
Here are a couple of reasons why you should invest in database monitoring:
- Reduce costs for your organization
- Shift from reactive to proactive monitoring, reducing the number of issues
- Improve the performance of your database and application
- Analyze logs and use this knowledge to improve performance
- Gain better insights through database health and performance metrics.
Best Practices for Database Performance Monitoring
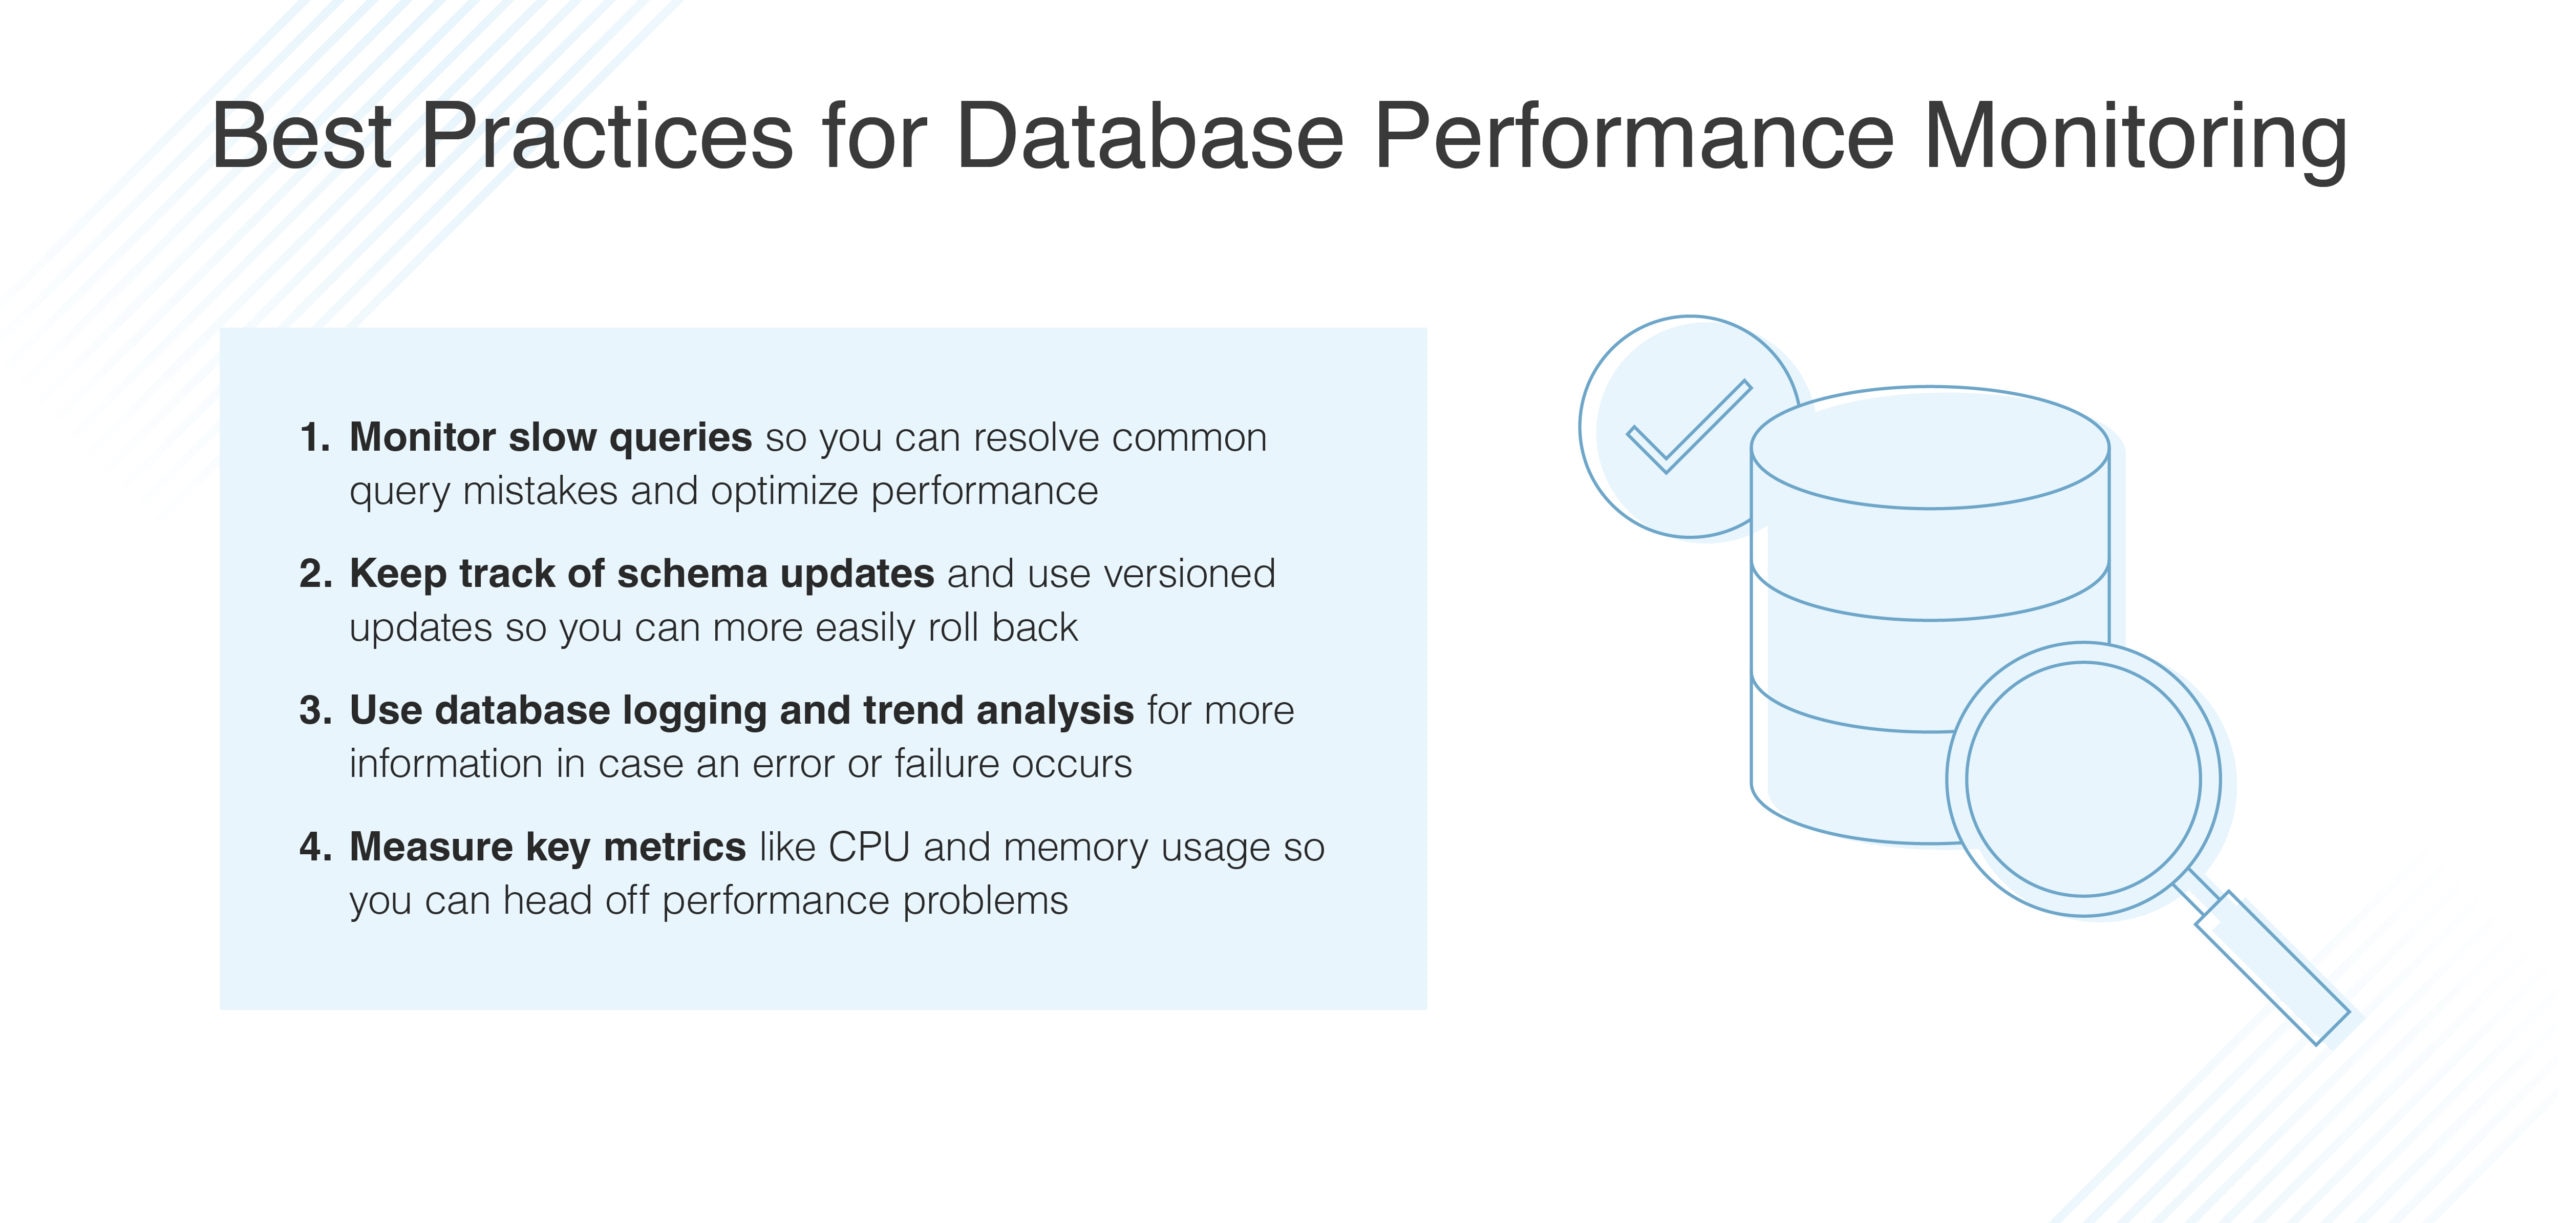
#1: Monitor Slow Queries
One of the most important aspects of monitoring database performance is tracking slow queries. Developers can use slow queries to further improve performance.
For example, say you’re running an application with a MySQL server. Every time a user logs in, a query is sent to the database to check the login credentials. If this is a slow query, it can have a serious impact on the overall performance of the database. To make things worse, if this query is used frequently, it can have a dramatic impact on the performance of your application.
It’s important to monitor expensive queries, so you can improve them to increase the overall performance of your application. Focus on frequently used queries, as they have the biggest impact on your application.
The easiest way to monitor slow queries is by tracking the time needed for a query to complete. Also, you can measure the resource usage for queries. Both should give you plenty of insights into the performance of database queries.
Common Query Mistakes
Often, more data is selected than needed. Remember a SELECT * statement for SQL queries. In most cases, you don’t need all this data. Only return the data you really need.
Developers often create inefficient joins between different tables, meaning they combine different types of data, which puts a lot of stress on your database. Joins are expensive operations for a database and can be best avoided. If you need a lot of joins, rethink the database model you’ve designed as there might be some flaws.
Lastly, an index is a great way of improving the performance of your application. However, having too many indexes might have adverse effects and slow down the performance of your application. In addition, indexes can become so large that they become slow eventually. Use indexes with caution and don’t overuse them like they’re the holy grail of database performance.
#2: Keep Track of Schema Updates
Changes to your database schema should be tracked, as those can have a significant impact on the performance. In addition, it’s not always easy to roll back to a previous schema when the current schema affects performance. You should use versioned schema updates, so you can easily roll back.
You can use a staging database that replicates production data to first try out the new schema to measure its performance. This is a safer way to upgrade to a new schema and detect potential performance issues. Besides, most databases natively support versioned schema updates, so they’re fairly simple to use.
#3: Use Database Logging
As with application logs, database logs are a very valuable piece of information. If there’s an error or failure, logs can help you solve a bug quickly and tell you what actions have been executed before the problem occurred. Logs make it easier to understand what exactly happened, helping you reduce the time to solve a bug and reduce costs for your organization.
Next, in combination with trend analysis, you can shift from reactive database monitoring to proactive database monitoring. Trend analysis helps you detect patterns in your logs to predict potential issues, so you can fix them before they happen.
For example, some malicious user tries to perform an SQL injection attack. Many failed queries might indicate something is wrong or someone is trying to attack the database. Trend analysis should detect this sudden increase in the number of failed queries.
As you can see, database logs can answer many questions and help you with auditing your database. This data can be used to further improve database performance.
Note: Besides AppOptics, tools like Loggly® and Papertrail™ can be used for monitoring logs and applying trend analysis. Check these out if you’re interested in proactive database monitoring.
#4: Measure Key Metrics
As said earlier, it’s of high value to measure metrics such as CPU and memory usage. Both are important for fine-tuning database performance.
Let’s say CPU usage spikes for some query. This indicates room for performance gains. For example, you might have forgotten to create an index in your database for a particular table, which helps with improving the performance for this query.
Another example shows your database needs more CPUs to handle the workload. If other services are running on the server, they might affect the performance of your database. Simple queries suddenly become expensive queries, as they don’t receive the correct amount of CPU power. To get a better understanding of your CPU usage, measure metrics such as average CPU usage and peak CPU usage. If these numbers are relatively high, it’s worth investigating what’s happening on your server.
Final Words
Database performance monitoring is mandatory if you’re responsible for the health and performance of applications and their underlying infrastructure. Slow queries can have a big impact on your application’s overall performance. It’s important to quickly identify those slow queries, so they can be improved. Database performance monitoring helps you detect such issues quickly.
Note: Tools like SolarWinds Database Performance Analyzer, SolarWinds SQL Sentry, and SolarWinds Database Performance Monitor offer a few ways to collect and view the key metrics needed to understand database performance.
Also, database performance monitoring can reveal issues with indexes or views. You might have created too many conflicting indexes that slow down the performance of your application. AppOptics offers full-stack monitoring of the infrastructure and the application, including the database. The ability to trace queries, so you can understand in depth what’s happening with your query and which indexes it consults. This information helps you solve performance issues faster, saving your organization time and money. Follow this link to sign up for a free trial of AppOptics and experience the benefits of using AppOptics when monitoring your database and other key elements of your infrastructure and application. Happy monitoring!
This post was written by Michiel Mulders. Michiel is a passionate blockchain developer who loves writing technical content. Besides that, he loves learning about marketing, UX psychology, and entrepreneurship. When he’s not writing, he’s probably enjoying a Belgian beer!