Modern businesses rely on a complex ecosystem of digital networks, databases, applications, user devices, and more. The tools and platforms supporting this ecosystem undergo constant refinement and upgrades. However, the basic methods for monitoring infrastructure and application performance have remained unchanged, and logging is one such methods. Every computer, server, networking device, and application produces logs, a timestamped record of events within a system. These records are immutable and provide an audit trail, which can be used for forensic investigations, troubleshooting, and application performance monitoring purposes. Log messages offer crucial insights into infrastructure and application performance, availability, and health. Hence, log monitoring tools or log analyzers are very useful for network administrators, application developers, site reliability engineers, and DevOps teams. Live tail is an important feature offered by such tools; in this article, we’ll discuss what live tail is and which are the best tools to tail logs available today.
What Is Live Tail?
Live tail is a command traditionally used in Linux/Unix based systems for monitoring logs in real-time. It’s a variation of the tail command, which allows you to see the last 10 lines of text. The tail -f command enables the follow mode and provides a real-time log tail, commonly known as live tail. With this command, the system prints the final 10 lines and then waits for new log files to update the log tail. This usually continues endlessly until a user intentionally ends the session.
In traditional environments, administrators use these commands to inspect local logs stored on individual servers. In rare cases, they may SSH into a remote server to access the log files. However, in modern environments, numerous log sources are spread across different on-premises and cloud-based infrastructure. Organizations need specialized tools to aggregate and transform all these logs into a common format for real-time monitoring. We describe some of these tools below.
Top Tools to Tail Logs and Simplify Real-Time Log Monitoring
Papertrail
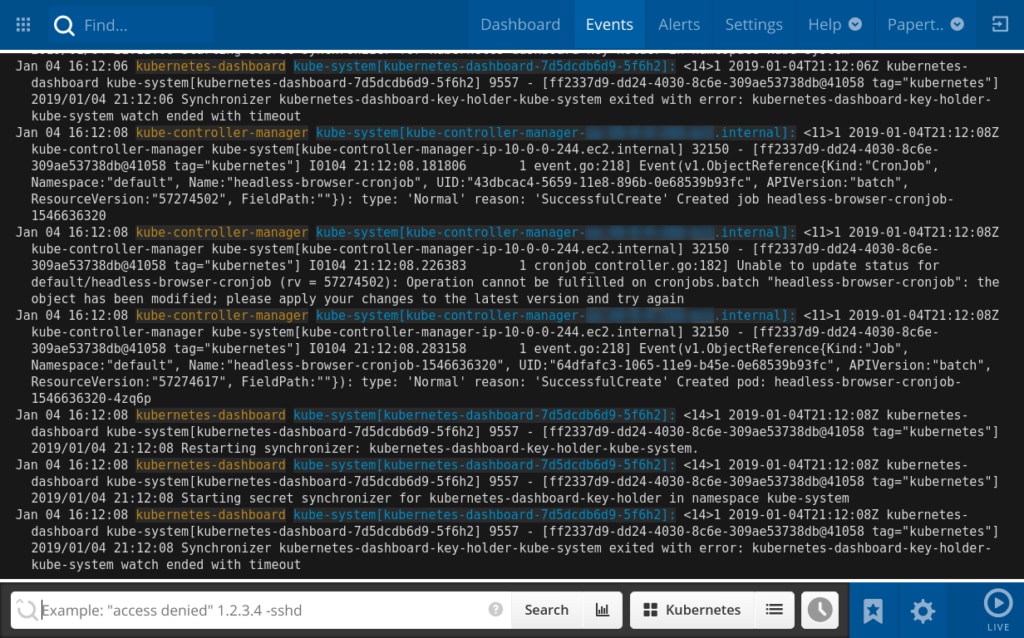
SolarWinds® Papertrail™ is a cloud-based log management tool designed to collect logs from a wide range of sources. Papertrail can be set up typically within minutes. It offers live tail with its real-time event viewer, where logs are updated continuously. The viewer supports infinite scroll, and the live feed of events can be paused with the click of a button. It also allows administrators to skip to a specific time to monitor events around that period. All the messages in the viewer are reformatted by Papertrail to have clickable elements (such as IP address or request ID). With this feature, developers can quickly inspect messages surrounding the clicked element. They can also search log messages using common search operators, save critical searches, and create alerts while saving the search. Developers can receive these alerts over their email or any other service (including Pagerduty and Hipchat). Another important feature of Papertrail is log velocity analytics, which helps you keep track of log volumes. Any significant variation in the quantity of log volumes usually indicates security or a performance-related issue. To evaluate the tool, you can get a free trial now and upgrade to a higher plan later.
LogDNA
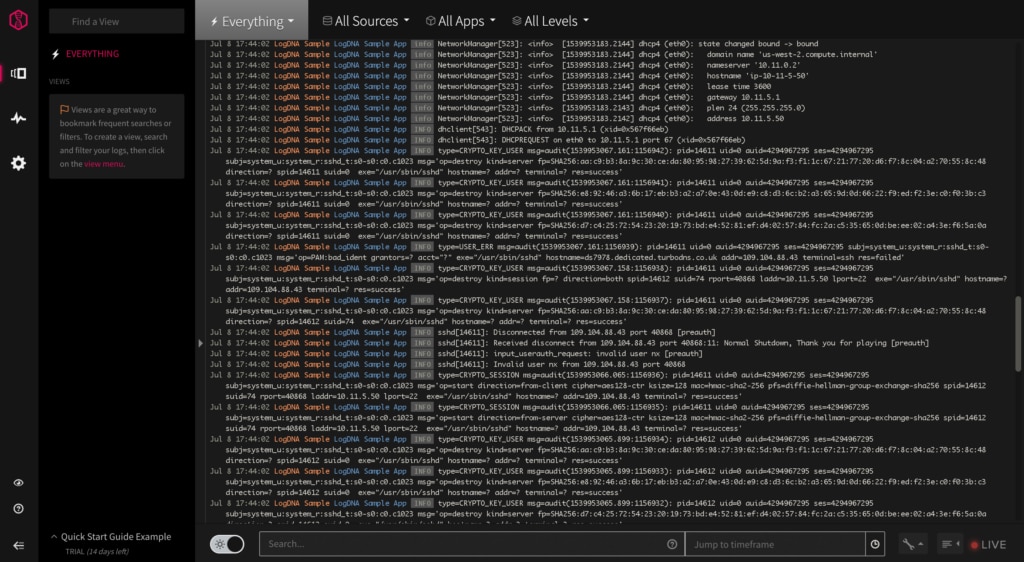
LogDNA is an advanced log management tool built for monitoring modern hybrid cloud environments. It also offers features for log aggregation and transformation. With this tool, teams can tail application logs to stay on top of performance issues in production environments. Further, it provides a unified view of log data from multiple sources. Its powerful search and filtering of log data help developers get to the root cause of issues faster.
Loggly
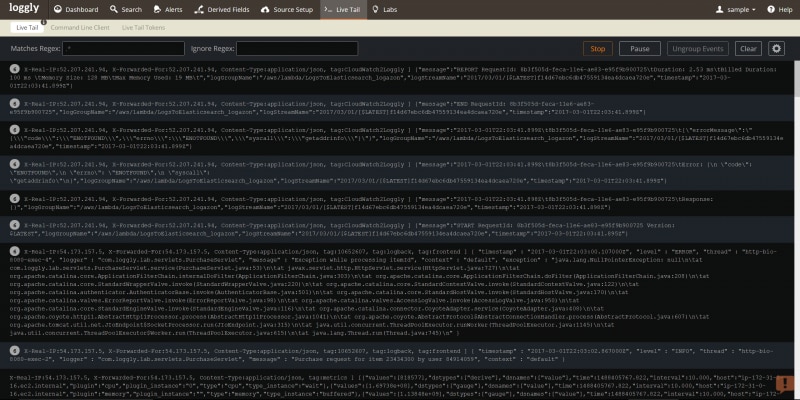
Loggly® is another SolarWinds tool for log management, which can help with real-time log monitoring and analysis. It has an agentless architecture, which simplifies the initial setup and helps aggregate logs without any lengthy configuration. The tool offers automated parsing for a wide range of log formats. Teams can also define custom parsing rules for logs. The parsed logs can be viewed in its Dynamic Field Explorer™, which provides a highly intuitive approach for log monitoring. In the explorer, you can click and surf through different fields without typing complex search queries. The tool also offers live tail across all log files from a distributed system. Developers don’t have to log in to remote systems or deal with administrators to get root access. Further, they can choose between the web UI and command-line client to tail logs. Loggly also offers several preconfigured dashboards for visual log analysis. These dashboards can be shared between team members to keep everyone on the same page. Further, Loggly offers easy integration with tools like Slack, Hipchat, and Pagerduty for alerts, and can also integrate with JIRA and GitHub to support DevOps workflows.
Sumo Logic
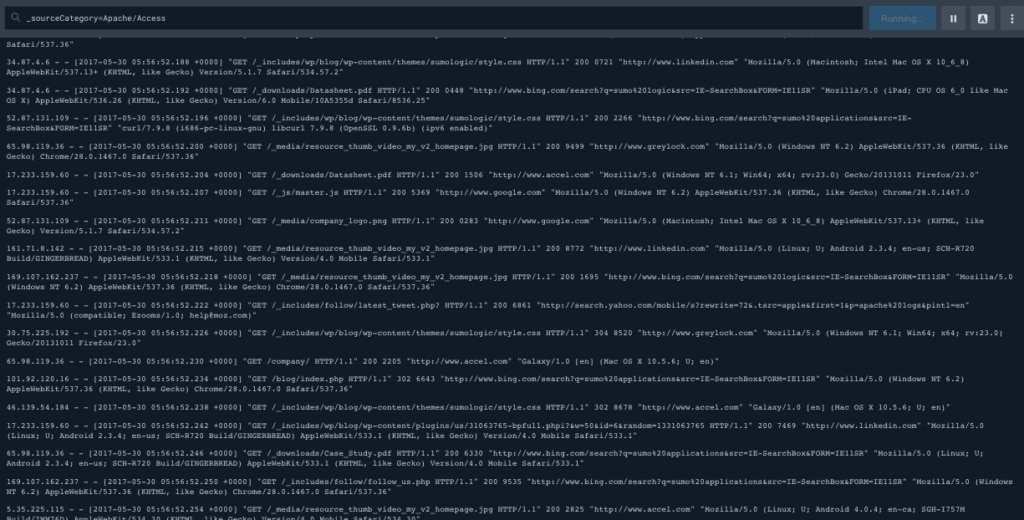
Sumo Logic is an end-to-end cloud-based log management solution, which can help organizations with their security information and event management (SIEM), application performance monitoring (APM), and DevSecOps. The solution builds upon its core log management capabilities and can help correlate log data from multiple sources with machine learning algorithms. Further, it also allows teams to monitor logs in real-time with the live tail feature. Advanced visual dashboards and intelligent alerting are other major highlights of the product.
ELK-Stack
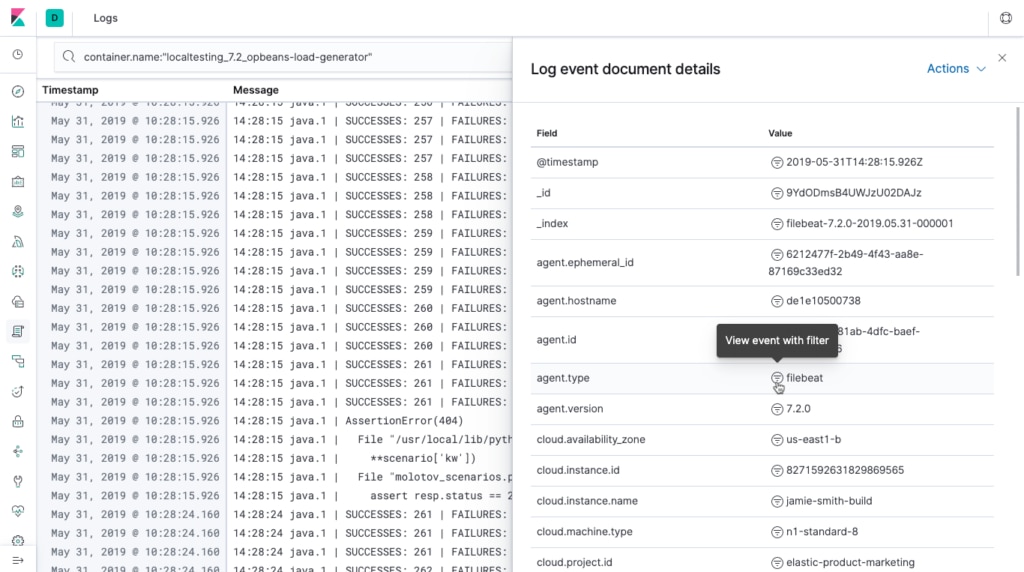
The ELK-stack (Elasticsearch, Logstash, and Kibana) is one of the most popular open-source solutions for log management and analysis. It includes three major tools: Elasticsearch, which offers Apache Lucene based distributed search engine; Logstash for log aggregation and transformation; and Kibana for visualization. Teams can also use Beats for log collection, as Logstash can be resource-intensive. Further, you may have to integrate open-source plugins to get a live tail of logs with Kibana. The stack can meet basic and advanced log management and analytics requirements but may pose configuration challenges.
Conclusion
Real-time log monitoring is essential for troubleshooting numerous applications and infrastructure issues before they lead to a major downtime. The tools mentioned above can administrators stay on top of their environment with live tail. While all the tools are highly capable and offer advanced capabilities for quicker processing of a large volume of logs, we recommend SolarWinds Papertrail for its simple interface and powerful features. Papertrail doesn’t require an elaborate setup, and you can download a free trial now to start real-time log monitoring.
