Large scale web applications experience a huge amount of traffic daily. Many of these applications include multiple transactions and content elements. Further, most of these applications are frequently updated with new features. Ensuring the moving components and the underlying architecture supporting the web apps perform as expected is a complex task. Any slow loading element or transaction can break the user experience. Pinpointing whether it’s a third-party service, a bug in the application code, or a server/hardware issue leading to performance lag isn’t simple. This is where log monitoring offers a solution. In this article, we’ll explore how log monitoring tools help in resolving technical issues, monitoring past trends for predictive analysis, preventing downtimes, and improving the app performance.
Why Do You Need Logs to Monitor Web Applications?
As discussed, there are numerous components involved in the functioning of a website. Web performance monitoring requires tracking these components with different tools and methods. There are numerous metrics to help in track uptime and gauge performance levels. Some of these metrics are linked to page speed (bounce rate, time to first byte, requests per second, etc.) and user experience, while others track server performance (CPU usage, disk space, bandwidth, etc.). You can use tools like SolarWinds® Pingdom® to track these metrics.
A big advantage of using metrics is they’re easier to instrument and implementation doesn’t increase resource consumption even when the log volumes increase. Metrics aggregate health information over a defined period, and unlike log messages, they don’t lead to increased consumption of memory space. While metrics can help in detecting performance issues or symptoms, they offer little help in finding out the root cause of the problem. Logs can provide actionable intelligence and help you trace the root cause of issues.
What Can You Track With Web Application Logs?
Log management tools help in monitoring server errors. For instance, Apache offers two types of logs—error logs and access logs. You can track error logs and HTTP status codes to detect problems. Most administrators gauge the count of errors or error rates. Log management tools can parse the Apache logs automatically, which helps in filtering the messages by their error codes. Any unusual rise in these rates and errors a cause of concern.
Web logs can also help you monitor page performance and provide early detection of network outages and protocol failures, failed services and batch/cron jobs, slow processes, and other network infrastructure problems. With these logs, you can also analyze the traffic to your server, top visitors, operating systems, and browsers. Further, by tracking failed user authentication, password changes, and other access related logs, you can improve the security of your website. The web logs are also crucial for security audits and can help you create compliance reports with data covering HTTP status codes, client and server errors, redirections, bad gateway, and unsupported media types.
With web log analysis, you can also identify any recurrent or lingering issues with your website. You can analyze historical trends to detect any anomalies or outliers and take remedial actions to resolve any potential issues with the website performance. Visualization tools can help you correlate past data from different sources with ease. Further, based on traffic growth and behavior in particular months/weeks of the year, you can forecast future resource requirements. Such capacity planning is crucial for maintaining high availability during peak traffic seasons.
However, to get the most out of website logs, organizations need a capable log management tool. While it’s possible to monitor a single server with local logs, organizations have to monitor multiple web properties, with applications running in a hybrid environment. In such environments, log volumes grow rapidly. A cloud-based log management tool or Logging as a Service (Laas) helps in meeting the scale and complexity requirements in modern IT environments. Such tools can ingest logs from multiple sources, transform these logs into a common format, parse all incoming log messages into important fields, and simplify search and analysis with advanced visualization tools.
How to Select a Log Management Tool to Monitor a Website?
There are numerous types of log management tools available in the market and to select one, you might have to run numerous proof of concepts (POC) and trials. However, we have evaluated most of these tools and will provide you with some pointers for shortlisting a solution for your organization.
Organizations are attracted towards open-source tools such as Logstash, or Fluentd for log aggregation. These tools provide a high level of flexibility and can suit the requirements of organizations of all sizes. However, creating an end-to-end log management setup with open-source tools requires multiple integrations. Teams have to configure tools like Elasticsearch and Kibana and make sure everything works in tandem with routine upgrades and performance tuning. These configurations can take significant time and effort, and the setup becomes more complex as organizations evolve over a period. That’s why organizations seeking higher agility and ease of management prefer commercial tools like Splunk, LogDNA, Sumo Logic, Logz.io, and others.
However, the ecosystem of commercial logging solutions is also vast and complex. For instance, certain tools align closely with network and security operations, while some others integrate with CI/CD processes and help in application performance monitoring in distributed environments. As logs are the basic building blocks of most of these solutions, they do offer log aggregation, search, and live tail features. However, these tools also have many advanced features and a steep learning curve. If your search is restricted to a capable log management tool, we recommend a free trial of SolarWinds Papertrail™. It’s a popular cloud-based logging solution designed to help proactively monitor web applications.
Why Start Monitoring With Papertrail?
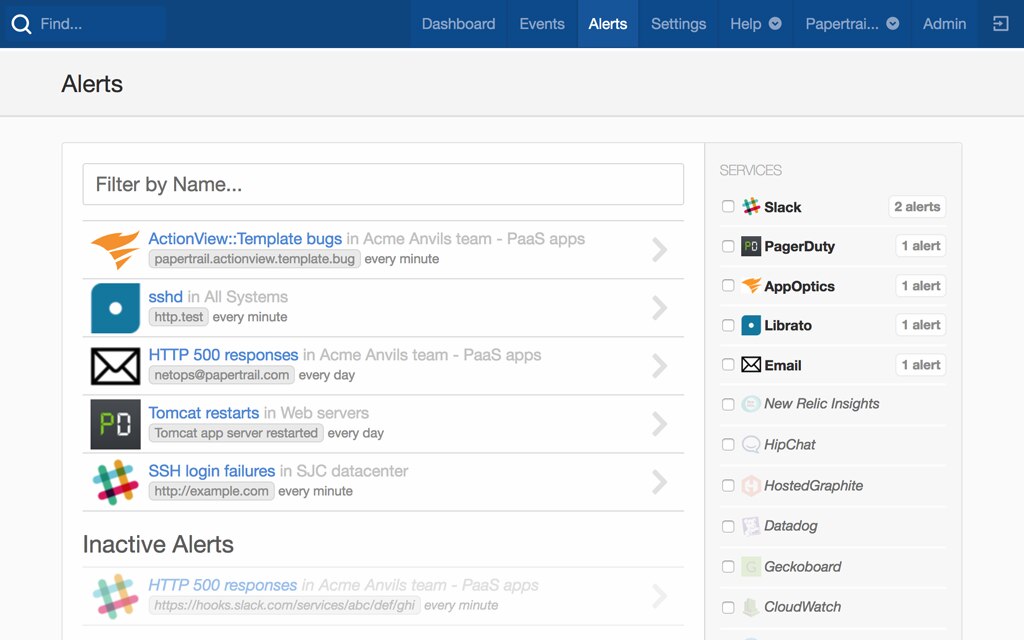
Papertrail is a cloud-based log management tool, which can be set up quickly and starts log monitoring within minutes. There’s no need to spend time in lengthy configurations. The tool can collect logs from all types of on-premises and cloud-based resources, applications, and network infrastructure. You can live tail your web server logs using its real-time event viewer, which offers infinite scroll, clickable message elements, pause and play, and “seek by time” features. The tool supports common search operators, and one can save important searches to expedite troubleshooting. Further, it integrates easily with popular services like Slack, Hipchat, etc. for alerts and notifications. Get started with a free trial of Papertrail now to explore all its features and capabilities.