SolarWinds DPA can collect a count of the number of deadlocks to be displayed as a resource graph. For Ignite versions prior to 8.2, you can update two files in order to start collecting the number of deadlocks.
Enabling DPA to Collect Deadlock Information
The code below takes advantage of the system_health extended event session that is enabled by default when SQL Server is started and should work with SQL Server 2008 SP1 and later versions.
- First, inside the <install dir> Ignite PIiwc omcatignite_configidcmetricscustom-metrics-queries.xml file add this entry:
<metricsQuery className="com.swi.idc.database.metrics.domain.queries.DeltaCalculationMetricsQuery">
 <sql>
 <![CDATA[
 select COUNT(XEventData.XEvent.value
('(data/value)[1]', 'varchar(max)')) AS cnt
 FROM
 (select CAST(target_data as xml) as TargetData
 from sys.dm_xe_session_targets st
 join sys.dm_xe_sessions s on s.address = st.event_session_address
 where name = 'system_health') AS Data
 CROSS APPLY TargetData.nodes
('//RingBufferTarget/event') AS XEventData (XEvent)
 where XEventData.XEvent.value
('@name', 'varchar(4000)') = 'xml_deadlock_report'
]]>
 </sql>
 <frequency>60</frequency>
 <queryTimeout>10</queryTimeout>
 <metricsList>
 <metric name="Deadlocks">
 <expression>args[0]</expression>
 </metric>
 </metricsList>
 <supportedDatabaseList>
 <supportedDatabase>
 <databaseType>SQL Server</databaseType>
 <minimumVersion>10.0.0</minimumVersion>
 </supportedDatabase>
 </supportedDatabaseList>
 </metricsQuery>
2. Then, in the <install dir>Ignite PIiwc omcatignite_configidcmetricscustom-metrics-properties_SQLServer.xml file add this entry:
<metricsProperties name="Deadlocks">
<displayName>Number of Deadlocks</displayName>
<description>Number of Deadlocks</description>
<category>Sessions</category>
<units>deadlocks</units>
<heartbeat>60</heartbeat>
<minY></minY>
<maxY></maxY>
</metricsProperties>
3. After editing those XML files you need to restart the Ignite service.
You should then see a graph in the ‘Sessions’ tab on the Resources page:
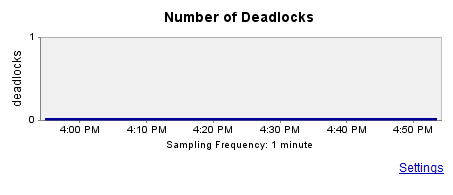
Now you will be able to see the number of deadlocks over time inside of DPA.
Enabling an Alert on Deadlocks
To configure an alert for deadlocks you do the following.
- Go to the ‘Alert’ page and create an alert of type ‘Custom SQL Alert – Single Numeric Return’. Name it ‘Deadlock Alert’ and choose an execution interval.
- Insert whatever notification text you want.
An example of a notification would be: “You have a deadlock. If you have trace flag 1204 enabled check your error log for additional details.” (Note: You only need to enable this trace flag if you desire to have a history of your deadlocks for analysis later. You do not need the trace flag if you only want to examine the deadlocks by querying the default trace as the deadlocks occur, keeping in mind that the information will not persist after a system restart.)
You can enable the trace flag globally by running the following command:
DBCC TRACEON (1204, -1)
Ideally you would enable this trace flag to be enabled upon startup. You do that using SQL Server Configuration Manager for the instance.
3. Right click on the instance name and go to ‘Properties’, then the ‘Advanced’ tab:
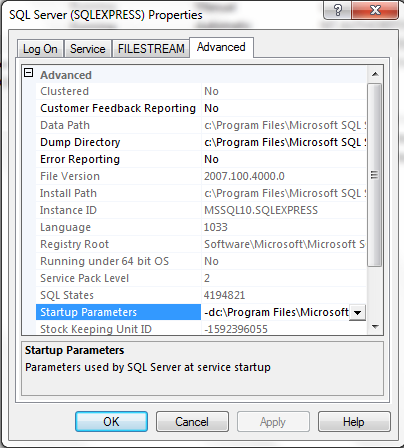
4. Click on the drop down for the Startup Parameters option and edit by adding “;-T1204” at the end as follows:
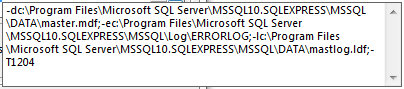
5. Click OK.
6. You will need to restart the instance for the parameter to take effect. If that is not possible at the moment it is fine as the the DBCC statement above will enable the trace flag immediately.
7. Back in the DPA GUI choose the instance(s) that you want to execute this alert against.
8. Then, enter the following code into the SQL Text window:
SELECT count(1)
FROM
(SELECT CAST(target_data as xml) as TargetData
FROM sys.dm_xe_session_targets st
JOIN sys.dm_xe_sessions s on s.address = st.event_session_address
WHERE name = 'system_health') AS Data
CROSS APPLY TargetData.nodes
('RingBufferTarget/event[@name="xml_deadlock_report"]') AS XEventData (XEvent)
WHERE DATEDIFF(mi, CAST(XEventData.XEvent.value
('@timestamp', 'datetime')as datetime), GETUTCDATE()) < #FREQUENCY#
9. Set the query to execute against the monitored instance.
10. Next, configure your thresholds and notification methods as desired.
11. Test the alert to verify it will run without error.
12. Then click save. You’re done.
If you are not using the trace flag to store the deadlock details for later analysis then you just need to run the code in order to pull the deadlock details back from the default trace.
Keep in mind that the details are reset (i.e., lost) after a service restart:
SELECT COUNT(XEventData.XEvent.value('(data/value)[1]', 'varchar(max)')) AS cnt
FROM (SELECT CAST(target_data as xml) as TargetData
FROM sys.dm_xe_session_targets st
JOIN sys.dm_xe_sessions s on s.address = st.event_session_address
WHERE name = 'system_health') AS Data
CROSS APPLY TargetData.nodes ('//RingBufferTarget/event') AS XEventData (XEvent)
WHERE XEventData.XEvent.value ('@name', 'varchar(4000)') = 'xml_deadlock_report'
Leave a Reply