Wi-Fi has become an essential component of our daily life, allowing for seamless connectivity between several devices. However, maintaining the best possible Wi-Fi performance and coverage may be difficult, particularly in complicated settings like huge stadiums, universities, and workplaces. Wi-Fi heat mapping is useful in this situation. Users may pinpoint places with weak connectivity by visualizing a space’s wireless signal strength and coverage areas and adjust their network architecture accordingly.
The Benefits of Wi-Fi Heat Mapping
Monitoring and Analyzing WiFi Networks
Types of Wi-Fi Heat Maps and Visualizations
Identifying Causes of Slow Wi-Fi and Boosting Wi-Fi Network Performance
Tools and Software for Automated Heat Mapping
1. SolarWinds Hybrid Cloud Observability (Free Trial)
Think of a Wi-Fi heat map as a visual representation of your Wi-Fi signal strength. It uses a color scale—typically ranging from green (strong) to red (weak)—to pinpoint areas with strong and weak signals. This information is crucial for businesses of all sizes. It empowers businesses to identify dead zones, interference sources, and areas of high traffic, enabling them to make informed decisions about network optimization and deployment strategies.
Throughout this post, we’ll delve into the world of Wi-Fi heat mapping, exploring its benefits, different approaches, and how it can help you monitor, analyze, and ultimately improve your Wi-Fi network performance. Get ready to unlock the secrets of your Wi-Fi and boost everyone’s connectivity.
Understanding Wi-Fi Heat Maps
Visual representations of your Wi-Fi signal strength across a given area are called Wi-Fi heat maps. Imagine a colorful map of your house or place of business, with green spots denoting a strong signal and red parts or dead zones representing weak or no signal. This makes it simple to determine which areas of your Wi-Fi network are the strongest and where it can be slow.
How Do Wi-Fi Heat Maps Work?
- Wi-Fi heat maps collect data from wireless access points and devices to measure signal strength and coverage.
- They use this data to create visual representations, typically color-coded, indicating signal strength levels across the coverage area.
- Wi-Fi heat maps may use specialized software or tools to collect and analyze data, such as signal strength measurements and access point locations.
- By overlaying these visualizations onto floor plans or maps of the area, users can easily identify signal coverage patterns and potential areas for improvement.
- Wi-Fi heat maps enable users to assess network performance, identify areas with weak or no signal coverage, and make informed decisions for optimizing Wi-Fi infrastructure.
Identifying Wi-Fi Dead Spots and Zones
Wi-Fi heat maps help pinpoint these problematic areas in a few ways:
- Color coding: Red areas on the heat map indicate weak or no signal, highlighting potential dead zones.
- Signal strength values: Some heat maps display actual signal strength values (like signal strength in dBm) alongside the color coding. This gives you a more precise understanding of signal strength variations.
- Device connectivity: Advanced heat maps might even show how many devices are connected to specific access points, helping you identify areas with overloaded networks.
By analyzing these factors within your Wi-Fi heat map, you can effectively identify dead zones and areas needing improvement within your Wi-Fi network.
The Benefits of Wi-Fi Heat Mapping
Wi-Fi heat mapping offers invaluable advantages for businesses and network administrators, enabling them to optimize network performance and enhance user experience.
- Importance for business networks: A strong and reliable Wi-Fi network is crucial for any business. Wi-Fi heat mapping allows you to visualize your network coverage, ensuring optimal signal strength for employees, customers, and connected devices. This translates to smoother workflows, improved productivity, and a more positive user experience for everyone.
- Enhancing user experience: By eliminating Wi-Fi dead spots and interference zones, heat mapping ensures consistent and reliable connectivity for users. It enables businesses to provide a seamless online experience for customers, boosting satisfaction and loyalty.
- Optimizing network performance: Wi-Fi heat maps don’t just reveal problems; they also help you fix them. By identifying areas with congested networks or overloaded access points, you can take targeted actions to improve performance. This might involve adding additional access points, balancing network load, or adjusting Wi-Fi channel settings.
- Capacity planning: As your business grows, so will your Wi-Fi demands. Heat maps help you anticipate future needs and plan for network expansion accordingly.
Monitoring and Analyzing Wi-Fi Networks
Maintaining a healthy Wi-Fi network requires consistent monitoring and analysis. Here’s how Wi-Fi heat mapping plays a crucial role in this process.
How to Monitor and Analyze Wi-Fi Networks
Keeping a check on your Wi-Fi network’s general health and performance is called monitoring. Although Wi-Fi heat maps visually show your network’s signal strength, there’s more to the story. What you can watch is as follows:
- Signal strength: This is the core function of Wi-Fi heat maps, allowing you to track signal strength fluctuations over time.
- Network connectivity: Monitor how many devices are connected to your network and identify any potential overloading of access points.
- Network performance: Track metrics like internet speed, latency (signal delay), and packet loss to ensure smooth data flow.
Tools and Techniques for Monitoring Wi-Fi Networks
There are several tools and techniques at your disposal for monitoring your Wi-Fi network:
- Wi-Fi heat mapping software: These software tools, sometimes included with your router or available as stand-alone apps, use your existing Wi-Fi hardware to collect data and generate heat maps.
- Dedicated Wi-Fi monitoring tools: Businesses with complex network setups might use specialized hardware tools that scan the environment and provide detailed network performance data.
- Built-in router tools: Many routers offer basic network monitoring features that can display information about connected devices, signal strength, and internet speed.
Analyzing Network Performance Metrics
Once you’ve collected data through monitoring, it’s time to analyze it. Here are some key network performance metrics to focus on:
- Signal strength (dBm): Measured in decibel-milliwatts (dBm), this indicates signal strength. Lower dBm values represent weaker signals.
- Signal-to-noise ratio (SNR): This ratio compares the strength of your Wi-Fi signal to background noise. A higher SNR indicates a clearer signal.
- Latency (ms): This refers to the time it takes for data to travel between devices. Lower latency is desirable for tasks like online gaming or video conferencing.
- Packet loss: This indicates the percentage of data packets that don’t reach their destination. Higher packet loss can lead to slow speeds and unreliable connections.
Types of Wi-Fi Heat Maps and Visualizations
Wi-Fi heat maps come in various offerings, each providing a unique perspective on your network’s health. Let’s delve into some of the most common types.
Coverage Heat Maps
These are the classic Wi-Fi heat maps you might be most familiar with. They focus on visualizing the overall coverage area of your Wi-Fi network. Imagine a map of your space, where green areas represent areas with strong signals and red areas indicate weak or no signals (dead zones). This helps you identify at a glance where your Wi-Fi reaches and where it doesn’t.
Signal Strength Heat Maps
While coverage heat maps provide a general overview, signal strength heat maps take it a step further. They use a more detailed color scale to represent the variations in signal strength across your network. Darker greens indicate strong signals, while lighter greens or yellows represent weaker signals. This allows you to pinpoint areas with just enough signal for basic browsing compared to areas ideal for high-bandwidth activities like video streaming.
Channel Interference Heat Maps
Do you ever feel like your Wi-Fi is sluggish for no apparent reason? Channel interference can be a culprit. These heat maps focus on visualizing interference from other Wi-Fi networks operating on the same channels as yours. Overlapping channels can lead to signal congestion and slower speeds. These heat maps typically use colors like blue or purple to represent areas with high interference. This helps you identify potential channel conflicts and optimize your network settings for better performance.
Capacity Heat Maps
Imagine a room full of people trying to use the same Wi-Fi connection—that’s what a congested network can feel like. Capacity heat maps allow visualizing the number of devices connected to each access point within your network. Densely populated areas (shown in red or orange) indicate potential overloading, while less populated areas (green) represent a healthy balance. This helps you identify areas where you might need to add additional access points to distribute the load and ensure smooth connectivity for everyone.
Identifying Causes of Slow Wi-Fi and Boosting Wi-Fi Network Performance
Slow Wi-Fi can be frustrating, but understanding its causes and implementing solutions can significantly improve network performance.
Wi-Fi Issues
- Slow Wi-Fi often results from common issues like signal interference, outdated hardware, or network congestion.
- Interference sources—such as neighboring Wi-Fi networks, electronic devices, or physical obstructions—can degrade signal quality and reduce connection speeds.
- Bandwidth limitations arising from insufficient network capacity or bandwidth-intensive activities can lead to slow Wi-Fi performance and connectivity issues.
Ways to Improve Wi-Fi Network Performance
Here are some key strategies to optimize your Wi-Fi network and experience the joy of smooth connectivity:
- Best practices for Wi-Fi optimization: Start with the basics! Position your router centrally and avoid placing it near walls or electronics. Restart your router regularly to clear temporary glitches. Consider using a Wi-Fi extender to boost the signal in far-off areas.
- Hardware and software solutions: Upgrading to a newer router with the latest Wi-Fi standards (like Wi-Fi 6) can significantly improve speed and range. Some routers offer built-in features like guest networks and parental controls. Wi-Fi mesh systems can be a great option for larger homes, providing seamless coverage throughout the space.
- Configuration tips for performance enhancement: Change your router’s default password for better security. Explore your router’s settings to optimize the Wi-Fi channel for minimal interference. Consider using features like quality of service (QoS) to prioritize bandwidth for critical tasks like video conferencing.
By implementing these solutions and leveraging the insights from your Wi-Fi heat map, you can create a robust, efficient Wi-Fi network that meets the needs of your home or business.
Automating Wi-Fi Heat Mapping
Imagine having Wi-Fi heat maps that update automatically, constantly monitoring your network health. This is the power of automated Wi-Fi heat mapping.
Benefits of Automated Wi-Fi Heat Mapping
- Effortless monitoring: There is no need to generate heat maps manually — automated tools collect data and update visualizations continuously.
- Real-time insights: Gain immediate visibility into network changes, allowing you to identify and address issues promptly.
- Historical data analysis: Track network performance over time. This helps you identify trends and optimize your network for future needs.
- Improved troubleshooting: Automated alerts can notify you of potential problems, making troubleshooting faster and more efficient.
- Enhanced user experience: By proactively maintaining a healthy network, you ensure a consistently smooth Wi-Fi experience for everyone.
Tools and Software for Automated Heat Mapping
Several user-friendly tools can help you leverage automated Wi-Fi heat mapping. Here are a few popular options:
1. SolarWinds® Hybrid Cloud Observability (Free Trial)

©2024 SolarWinds Worldwide, LLC. All rights reserved.
This self-hosted [EK1] observability solution built on the SolarWinds Platform offers built-in Wi-Fi heat mapping features. It provides a comprehensive view of your network health alongside other critical metrics like bandwidth utilization, device connectivity, and application performance. This consolidated view empowers you to identify potential bottlenecks and optimize your network performance for a seamless user experience.
Learn more Download Free Trial
Key Features:
- Real-Time and Historical Wi-Fi Heat Mapping Alongside Other Network Metrics: Gain immediate insights into your Wi-Fi network’s current state and historical trends through real-time and historical heat maps. These visualizations depict signal strength variations alongside other network data like bandwidth usage and device connectivity, helping you pinpoint areas requiring optimization.
- Customizable Dashboards for Tailored Network Monitoring: Hybrid Cloud Observability provides customizable dashboards that cater to your specific needs. Tailor the view to display a combination of relevant network metrics alongside your Wi-Fi heat map for focused monitoring.
- Proactive Troubleshooting With Alerts and Notifications: Offers intelligent alerting systems that notify you of potential network issues based on predefined thresholds. For example, you might receive an alert if a significant drop in signal strength is detected in a specific area, prompting you to investigate and address the cause.
- Scalable Solutions for Managing Various Size Networks: This solution offers scalability to accommodate your network’s size and complexity, making it ideal for organizations managing extensive Wi-Fi networks across multiple locations as well as small businesses.
2. Ekahau HeatMapper

© 2024 Ekahau, Inc. a Ziff Davis company. All rights reserved.
This dedicated Wi-Fi heat mapping software caters to both basic and advanced needs. It allows for both manual and automated heat map generation, capturing real-time network snapshots or scheduling ongoing monitoring. Ekahau goes beyond visualization with features like signal strength analysis and channel optimization to improve network performance.
Key Features:
- Manual/Automated Heat Maps for Flexible Monitoring: Ekahau HeatMapper provides the flexibility to create heat maps manually or leverage automated scheduling. This caters to both capturing a snapshot of your network state at a specific point in time (manual) and monitoring network performance trends over time (automated).
- Advanced Signal Strength Analysis for Weak Signal Zones: This might include interference from other devices, physical obstructions, or limitations of your access points. This analysis empowers you to make informed decisions for network optimization.
- Channel Optimization Recommendations to Minimize Interference: Ekahau HeatMapper analyzes your network environment and recommends optimal channels for your access points, minimizing interference and ensuring efficient Wi-Fi operation.
- Reporting Tools to Document Network Performance: Ekahau HeatMapper provides comprehensive reporting tools that allow you to document your network’s performance over time. These reports can include heat maps, signal strength analysis data, and channel optimization recommendations. This documentation is valuable for tracking network progress, justifying network upgrade decisions, and providing historical data for future reference.
3.Acrylic Wi-Fi
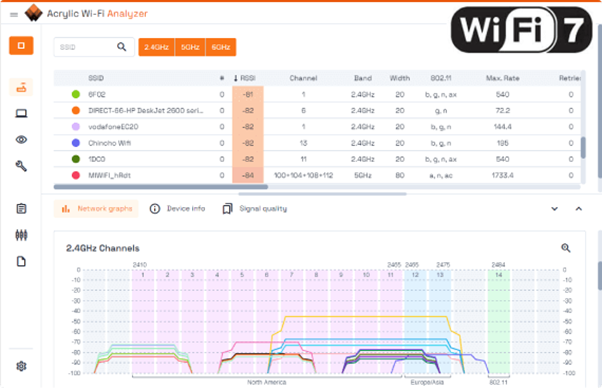
© 2024 Acrylic Wi-Fi software by Tarlogic Security
This software provides real-time Wi-Fi heat maps and network analysis tools, making it a versatile option for both basic and in-depth network assessments. With Acrylic, you can analyze network performance metrics like signal strength, data rates, channel interference, and connected devices.
Key Features:
- Real-Time Heat Maps with Detailed Signal Strength Visualization: Acrylic Wi-Fi offers real-time heat maps that provide a clear visual representation of signal strength variations across your coverage area, helping you identify weak signal zones and areas requiring optimization.
- Comprehensive Network Analysis for Data Rates, Channels, and Devices: Beyond heat maps, Acrylic Wi-Fi offers a suite of network analysis tools to delve deeper into your network’s health. Analyze data rates and channel usage and identify potential interference sources to diagnose and troubleshoot network issues.
- User-Friendly Interface for Easy Navigation and Data Exploration: This software prioritizes user-friendliness with a clear and intuitive interface. This makes it accessible to both network professionals and home users.
4. NetSpot
Designed for user convenience, NetSpot leverages your existing Wi-Fi adapter to generate heat maps and analyze your network. NetSpot offers a cost-effective solution for smaller networks without requiring additional hardware purchases. It provides key functionalities like real-time signal strength visualization, channel analysis, troubleshooting tools, and historical data tracking to help you pinpoint Wi-Fi weaknesses and optimize your network setup over time.
Key Features:
- Cost-Effective Heat Mapping Using Existing Wi-Fi Adapter: NetSpot eliminates the need for additional hardware purchases by utilizing your existing Wi-Fi adapter for heat map generation. This makes it a budget-friendly option for users who don’t require extensive network analysis capabilities.
- Real-Time Signal Strength Visualization for Immediate Insights: Gain immediate insights into your Wi-Fi network’s health with real-time signal strength visualization. NetSpot’s heat maps depict signal strength variations, allowing you to identify weak signal zones and prioritize optimization efforts.
- Channel Analysis and Troubleshooting Tools: NetSpot equips you with channel analysis tools to identify potential congestion issues caused by overlapping channels. It also provides troubleshooting tools to pinpoint and diagnose network problems impacting performance.
- Historical Data Tracking to Monitor Network Performance Over Time: Track your network’s performance trends over time by leveraging NetSpot’s historical data tracking functionality. This allows you to assess the effectiveness of implemented changes and identify recurring network issues.
5. NetAlly
This company offers a suite of network testing tools, including some specifically designed for automated Wi-Fi heat mapping. NetAlly’s solutions cater to complex network environments, providing detailed heat maps alongside in-depth network analysis. These advanced tools are ideal for network professionals who require comprehensive data to optimize large-scale or mission-critical networks. NetAlly’s Wi-Fi heat mapping solutions often integrate with their broader network testing toolset, offering a unified platform for network assessment and troubleshooting.
Key Features:
- Advanced Heat Maps with Detailed Signal Strength and Channel Data: NetAlly’s heat maps go beyond basic signal strength visualization. They provide detailed data about signal strength variations and channel utilization across your network, empowering you to make informed optimization decisions.
- In-Depth Network Analysis for Comprehensive Network Assessment: In addition to heat maps, NetAlly offers a robust suite of network analysis tools for comprehensive network assessment. Analyze data rates, identify interference sources, and diagnose network issues impacting performance.
- Integration With Other Network Testing Tools for Unified Monitoring: NetAlly’s Wi-Fi heat mapping solutions often integrate seamlessly with their broader network testing platform. This unified view allows you to monitor and troubleshoot all aspects of your network performance from a single location.
- Scalable Solutions for Managing Large and Complex Networks: NetAlly’s solutions are designed to scale and handle the demands of complex network environments. This makes them ideal for organizations managing large-scale Wi-Fi deployments across multiple locations.
By exploring these options and considering your specific needs, you can find the ideal automated Wi-Fi heat mapping solution to keep your network running smoothly.
Conclusion
In this post, you’ve explored the domain of Wi-Fi heat mapping, delving into its significance for enterprises and network optimization. From learning the principles of Wi-Fi heat maps to analyzing various types of heat maps and visualization approaches, you’ve gained insights for assessing Wi-Fi coverage, identifying network faults, and optimizing performance. You’ve also seen the benefits of automated Wi-Fi heat mapping software and emphasized important software options for expediting the mapping procedure. Now, you have all the information and resources you need to successfully optimize your Wi-Fi networks by learning about the significance of Wi-Fi heat mapping and discovering useful tools and techniques for network analysis.
This post was written by Gourav Bais. Gourav is an applied machine learning engineer skilled in computer vision/deep learning pipeline development, creating machine learning models, retraining systems, and transforming data science prototypes into production-grade solutions.
Leave a Reply