Real-time troubleshooting of slow-performing applications is not an easy task using traditional measures, as you need to spend critical time reviewing logs and other indicators of performance issues. OEM Cloud Control 12c offers powerful instrumentation that lets you search transactions based on their message content and time of arrival, thus helping quickly identify and fix technical exceptions or slow performance conditions. By letting you drill down to the root cause of problems through the precise transaction based on the message content and context (time of arrival, customer ID, and so on) as well as by correlating application invocations, Cloud Control 12c dramatically reduces the time to diagnose run-time issues, as well as the mean time to repair.
What makes Cloud Control’s root cause analysis capabilities really powerful is its ability to handle a wide array of causes, ranging from high-level causes such as application faults and exceptions, to low-level issues caused by bad data, for example. You can choose from this wide variety of potential exceptions, following which Cloud Control will monitor the system traffic and catch the exceptions as soon as they occur. As you can imagine, this is a vastly superior method of tracking exceptions and failed transactions, when compared with the traditional “method” of poring over hard-to-access log files. Cloud Control automatically aggregates messages from all the components involved in serving the application and tags the exceptions and faults in real time. It’s this ability to offer speedy diagnostic data that enables administers to quickly analyze and repair performance problems.
Diagnostic Snapshots
You can diagnose performance data for a JVM target in the offline mode by creating diagnostic snapshots. A diagnostic snapshot captures live performance data for a specific period and allows you to perform offline diagnostics on the captured data. Use the Diagnostic Snapshots page to create diagnostic snapshots and export the diagnostic data to a file that you can then export to a different host. You can also view a diagnostic snapshot from this page. The View option lets you view summary information such as the targets, target types, and the diagnostic information collected for a specific diagnostic snapshot. By clicking Analyze on this page, you can analyze a snapshot from the Analyze Diagnostic Snapshot page. By analyzing a diagnostic snapshot, you can view details about a JVM such as the thread stack, CPU, and heap utilization and garbage collection. You can also view a graph for active threads.
The ability to create a diagnostic snapshot means that you can focus on fixing the performance problem at hand and analyze the captured details later on to isolate the root cause. Usually there’s no time to diagnose performance problems when you’re in the throes of the problem. Your priority during that time is going to be the restoration of the application to its normal performance so users can continue their work. Often, you may want to capture a set of diagnostics in your production environment for use later on either by you or by Oracle support. Oracle Enterprise Manager’s Diagnostic Snapshots feature enables you to create performance snapshots that capture JVM operational data relating to the memory and CPU usage, threads, and garbage collection, along with the WebLogic logging information.
Generally, a diagnostic snapshot contains all the data necessary to resolve a performance issue. The specific diagnostic data differs based on the type of target, but as long as you pick any Fusion Middleware component, diagnostic log message data is included in the diagnostic snapshot. You can generate a snapshot for any target, including a Fusion Middleware farm. You can send these snapshots to Oracle Support or export them to another OEM Cloud Control. Thus, diagnostic snapshots offer yet another means of drilling down to the root cause of performance issues in middleware applications.
Creating Diagnostic Snapshots
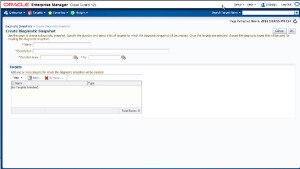
You can create a diagnostic snapshot in the context of one or multiple Fusion Middleware farms. You can create a diagnostic snapshot by going to Targets | Middleware and choosing Manage Diagnostic Snapshots from the Middleware Features menu. Initially you’ll notice the message “No Diagnostic Snapshots Available” under the Diagnostic Snapshots section. In the Diagnostic Snapshots section, click Create to create a diagnostic snapshot. Figure 1 shows the Create Diagnostic Snapshot page. You can select the targets for generating the snapshot, the duration of the period during which Cloud Control collects the data, and choose to import the snapshot data into a local Enterprise Manger instance or export it to a file(s) for import to a different Enterprise Manager instance.
FIGURE 1. Creating a diagnostic snapshot
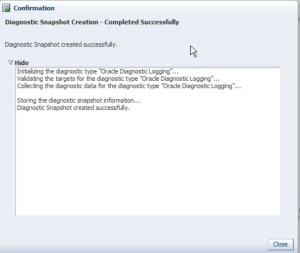
Once you create a new diagnostic snapshot and click OK, you’ll get a confirmation from OEM Cloud Control, letting you know that the diagnostic snapshot creation completed successfully, as shown in
Figure 2.
FIGURE 2. Confirmation following a successful diagnostic snapshot creation
Managing Diagnostic Snapshots
In the Middleware Home page, choose Manage Diagnostic Snapshots from the Middleware Features menu, to display and manage diagnostic snapshots. The page displays all available diagnostic snapshots in a tabular form. You can view and analyze the diagnostic snapshots from this page. You can also import and export the diagnostic snapshots into a different Enterprise Manager Instance from this page.
In order to analyze a diagnostic snapshot, select a diagnostic snapshot and click Analyze. The Analyze Diagnostic Snapshot page, shown in
Figure 3, presents a summary of all diagnostic types of the diagnostic snapshot and a summary of the diagnostic snapshot.


Leave a Reply