Once a middleware target such as an Oracle WebLogic domain is added to Cloud Control’s list of targets, you can view the status of that target. You can view alerts generated for each managed middleware target. For both individual deployed applications, WebLogic servers and WebLogic domains, you can view the following pages by selecting Monitoring from the target’s top level menu drop-down (such as the WebLogic Domain drop-down menu in the domain’s home page):
- All Metrics Shows a list of all performance metrics you can select from for alerts, as well as the top five alerting metrics for the last seven days, with both the warning and critical alerts for each of those five alerts.
- Metric and Collection Settings This page shows all the metrics with threshold values. For example, a WebLogic server may have a JVM Metric such as Heap Usage (%), with a warning threshold of 80 percent and a critical threshold of 90 percent. By default, the collection schedule for this metric is every 15 minutes. For a metric such as Response, the schedule is every 1 minute.
- Metric Collection Errors Any metric evaluation errors, which are usually caused by installation or configuration errors.
- Incident Manager Shows all open incidents and problems, including escalated and unassigned incidents.
- Alert History Shows critical and warning alerts in a chart form.
- Blackouts Allows you to suspend monitoring on a target while performing maintenance operations.
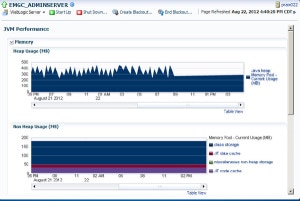
In addition to these standard metrics pages, WebLogic Server also has additional metric pages such as Performance Summary and a JVM Performance page. Figure 1 shows the JVM Performance page for a WebLogic server. In a similar fashion, application deployment targets have specialized metrics pages, such as the Application Dependency and Performance page and the Request Monitoring page.
The JVM Performance page shows charts for the heap usage, as well as active and locked JVM threads and the performance of the garbage collection, with metrics for collections per minute and the average garbage collection time.

Leave a Reply