Note: Part 1 of this story ended with my client’s application performing much better after a quick workaround to some blocked sessions in SQL Server; this part of the tale deals with root cause remediation of a blocked sessions problem encountered in SQL Server.
The Situation, According to the Triage Team: Contention from Long-running SQL Queries
To recap, a client had asked me to assist with a performance issue impacting the help desk ticketing system. Long wait times were causing increased call handle times, to the point where the caller’s data was being written down by hand and then applied to a ticket after the call ended.
Here’s how the client’s triage team had summarized the initial situation: highly-parallelized queries were encountering contention for objects (LATCH_EX) – tables and indexes – resulting in delayed parallel processing (CXPACKET), creating a bottleneck by blocking query execution for other sessions (blocked sessions). Recall also that the customer experience improved immediately and significantly, once the hot update to reduce the MAXDOP value decreased the CPU footprint for the poorly performing SQL queries.
At that point, the ticketing system users had reported that the system was performing better than ever. Instead of calling it a day, the triage team still had an “ace up our sleeve.” to bequeath superior performance upon the users, by eliminating the underlying root cause.
Root cause had been defined as a contention problem stemming from long running SQL queries. The fix required testing in a non-production environment, while in parallel, change approval was sought through the change board. After the DBA provided stats showing which queries were consuming the most CPU time and which queries executed most frequently, the triage team focused on finding all queries satisfying two carefully worded and technically defined attributes: runs often, runs long.
Taking action: queries with 30-second run times
Based on earlier network traffic analysis, a thirty-second response time pattern (Figure 1) had been identified across most connections, providing us with a first iteration baseline: check for queries having a near thirty second average run time.
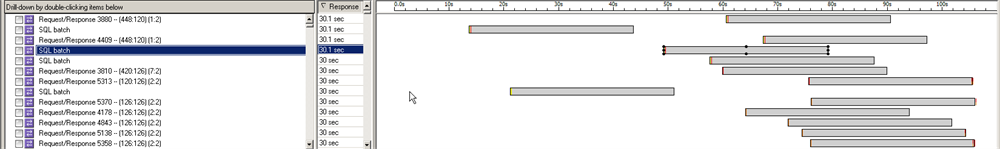
Figure 1. Network Traffic Analysis Shows 30-second Response Time Pattern.
Bubbling to the top of the violators list were several queries on one table matching the ticketing system vendor’s watch list, provided earlier as a heads-up; this table was on the vendor list, while the associated queries matched the run duration baseline.
Targeting the query short-list, several index modifications were identified, tested and upon change approval, implemented during the defined production change window.
As a result, Figure 2 shows a further decrease in blocked sessions driven by sub-second query response times, based on new execution plans using the modified indexes.
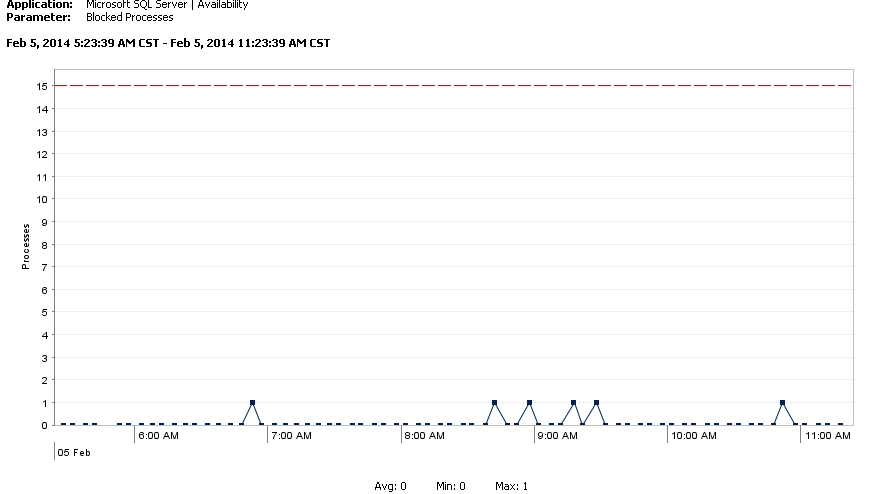
Figure 2. Decrease in Blocked Sessions.
Charts covering longer time periods show the data points as a flat line resting on the zero line. Performance is terrific!
Questions remain: why is CPU consumption erratic?
The client’s teams are currently working through the larger list of identified performance opportunities, which is an iterative processes requiring time.
In the meantime, I am left wondering. The MAXDOP setting needs additional consideration and testing, after the index changes and other performance improvements have been completed. While the immediate benefit relieved pressure, a very likely side-effect could be CPU starvation for queries needing to leverage parallel processing. Besides, I really want to know (need to know) why CPU consumption is so erratic (Figure 3) on the database server.
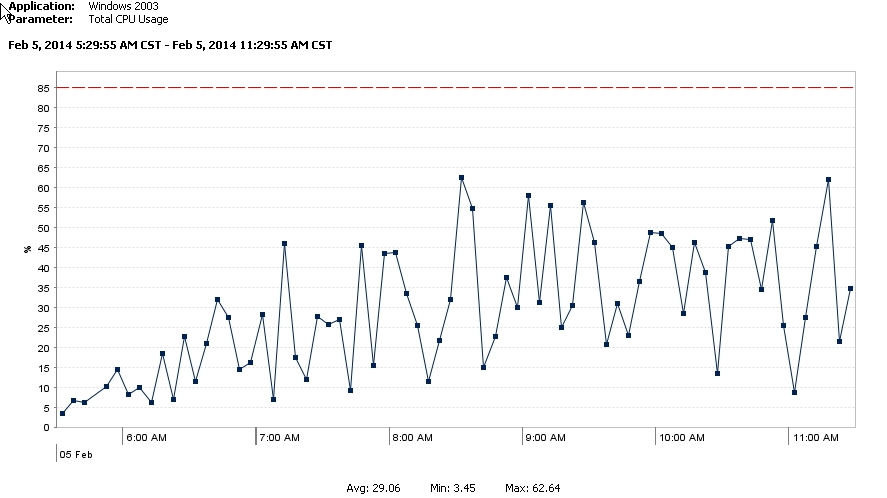
Figure 3. Erratic CPU Consumption.
Perhaps further information will reveal answers!
[…] sure to read Part 2 of this story, to learn how we were able to provide root cause remediation of this […]