An Extended Event target is the destination for all the information you can capture with Extended Events. The terminology involved with Extended Events is less self-explanatory and may have made you think twice about using Extended Events. Fortunately, the SQL Server Management Studio (SSMS) interface hides some of the complexity from us.
Event files
Event files, like their name suggests, are flat files that reside on an operating system drive and to which event data is written. They remain there until you delete them manually. The event files themselves have a default file extension of .xel and store data in a binary format that isn’t human-readable without a tool such as SQL Server Management Studio. Fortunately, SSMS can open these files even if they were captured on another server. It can also export the data to a database table or a CSV file, making the data more portable if needed.
When an Extended Events session is configured to use an event file as a target, the event data is first written by the Extended Events engine to memory buffers before a second process writes it from memory to disk. This separation of processes is an important difference between Extended Events and other troubleshooting tools, as it prevents the physical writing of the data to disk from affecting performance for end users under normal circumstances. This behavior explains why event files are considered asynchronous targets.
Because Extended Events has been designed for use on servers with even the heaviest of workloads, there are several options you can configure regarding how the data is buffered and what should occur when the buffer is overwhelmed. The next three settings reviewed, memory buffer size, event retention, and maximum dispatch latency, apply to most of the targets Extended Events sessions can use, but it is useful to consider them now that you understand the potential problems a session with a full memory buffer and an event file target could have.
It’s worth mentioning that the path and filename you specify when you create a session must exist otherwise the session won’t start. It’s often useful to create your own directory for Extended Events files, and then make sure SQL Server can read and write to it.
Memory buffer size
The size of the memory buffer is a configurable session option that can ultimately determine how much of a performance impact an Extended Events session has on your server, and potentially how much event data you might lose in busy conditions. For a small server with a small workload, the default maximum buffer size of 4MB is probably sufficient; but on a much busier server, you might be writing more event data to the memory buffer than your target can subsequently flush to its storage during peak periods.
As a hypothetical example, if your Extended Events session is capturing event data at the rate of 200MB/sec, but your server can only write 100MB/sec to disk, you’re very quickly going to either need a lot of memory to store events before they’re flushed to disk or begin discarding data from the buffer. The buffer is a First in, First out (FIFO) list, so if unflushed events need to be deleted to make room for newer events, then the oldest ones will be removed first.
That example should explain why you might choose to configure your session to use more memory, based upon your preference for what should happen if the buffer ever fills up, and therefore, how much event data you’re willing to lose in order to maintain system performance for users. Exactly what events are dropped is determined by the Event Retention option.
Event retention
What should happen if the memory buffer ever fills up is also a configurable session option, known as Event Retention. Three options determine how SQL Server should respond when the memory buffer is full and a session tries to write event data to it:
- no event loss — This option is the strictest of the possible settings and is not recommended for production environments. This setting means if the memory buffer ever fills up, end user queries must wait until there is free space in the memory buffer for their event data to be written to before they are allowed to continue. It’s very similar to how SQL Trace works in that event data is never lost, but the consequences of guaranteeing that complete set of event data on a busy system can be disastrous.
- single event loss — This is the default when you create an Extended Events session. It instructs SQL Server that losing individual events is acceptable if it means the end user’s query performance won’t be affected like it would be with the no event loss option. Because the memory buffer is a FIFO list, the oldest event in the buffer is deleted to make room for the latest system activity. Although events are removed one at a time, if the Extended Events engine needs to write 500 new events to the buffer, it may have to delete the 500 oldest events first. While this sounds like a good compromise, it won’t protect you from having an undersized memory buffer on a busy system, as ultimately the amount of data you lose will render your captured data worthless.
- multiple event loss — This tells SQL Server to favor protecting query performance at the expense of capturing event data on a massive scale. If the memory buffer is overwhelmed by incoming events, it can decide to completely empty the buffer rather than delete events one by one to maintain query performance. While this might mean you lose your event data, it’s a good fail-safe option to have in place if you ever deploy a session on a busy server for the first time and not know what its event generation rate is likely to be.
Maximum dispatch latency
Now that you’ve seen how crucial it is to have adequate space in the memory buffer used by the Extended Events engine, you can understand why there are various options that determine what should happen if it fills up. Of course, the best solution is to ensure that it never fills up. There are two options for this: setting a very large memory buffer size or configuring the maximum dispatch latency.
If an asynchronous target is being used, it’s possible that events aren’t transferred from the memory buffer to the target until either the session stops and flushes the buffer, or there is memory buffer pressure that forces a flush. This shouldn’t usually be a problem, but you might think it’s good to keep as much free space in the memory buffer as possible in case of sudden system activity that generates a lot of event data.
This is where you can use the Maximum Dispatch Latency setting to specify the maximum amount of time event data can stay in the memory buffer before it is flushed to the target. The default is 30 seconds, which for a session with a properly sized memory buffer should be more than adequate; there’s no need to change any of the default settings unless necessary. However, if you want to be cautious you can lower the maximum dispatch latency value; the minimum accepted value is 1 second.
Ring buffer
Having looked at some of the options for sessions, we return now to some of the other targets that SQL Server allows a session to use. The ring buffer behaves much like the event file target in that it’s an asynchronous target for events to be written to, and it stores them in a FIFO list. A big difference, however, is that SQL Server Management Studio doesn’t provide a way to translate its XML contents into human-readable data like it does for the event file. Instead, a T-SQL query needs to be used to extract the fields you want out of the ring buffer; and while this is relatively straightforward (and demonstrated later in the chapter), it’s a step back from the simplicity that the graphical user interface provides to newcomers of the feature.
Another difference of the ring buffer is that it doesn’t use any physical storage — it’s purely an in-memory structure, much like the memory buffer itself. Obviously, this means that data in it is lost not only when the ring buffer fills up and space has to be made for new events, but also whenever SQL Server itself is stopped. This doesn’t make it suitable for reactive monitoring of historic system issues; but because you can have a target with a very low write latency that doesn’t need housekeeping afterward, it is suitable for either high-level real-time monitoring of production systems or low-level controlled testing on development systems.
The ring buffer has two size parameters you can configure: either the total amount of memory it will use, or the amount of memory per event it will use. Until you understand more about how you can use the ring buffer, the default settings are more than adequate.
Event counter
The event counter is one of three targets that don’t store any of the event data sent to them but instead perform a task with it. The event counter target does what its name suggests; it counts the number of times the event occurs. Unlike some other targets, however, it doesn’t require any event data or actions to be sent to it; the fact that the event has occurred is all it requires to increment the counter value it’s maintaining. In order to provide an accurate event count, access to update it is serialized, so it has to be used as a synchronous target. This shouldn’t cause you any performance issues though, as it’s a very lightweight target that requires very little data to be sent to it.
Event counters, like the ring buffer, are in-memory structures. Therefore, their content is never written to an event file and is lost when SQL Server shuts down.
Histogram
The histogram could well be the most useful target in your early, and perhaps later, stages of troubleshooting — if only to begin identifying trends in your data that enable you to focus on a particular type of event’s details.
For example, the wait_stat event reports every type of wait stat as they occur, but you’ll probably want to know which types of wait stats occur the most often. If you were to use the event counter target, that would just tell you the total number of wait stats that have occurred so far, whereas the histogram will tell you how often each type of wait stat has occurred.
At this point, however, you begin to see where the user-friendly and quick-to-deploy side of Extended Events is countered by the programmatic T-SQL and XML-heavy side of the feature. When the histogram reports aggregated data about event activity, it uses internal identifiers rather than the friendly names we’re used to in its results, as shown in Figure 1.
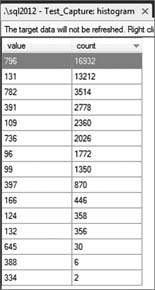
Figure 1. Example histogram
This indicates that wait stats 796 and 131 are occurring the most often, but a DMV lookup is needed to know what they are:
select map_key, map_value from sys.dm_xe_map_values where name = 'wait_types' order by map_key
In this instance, you can manually look up the wait types and see they were DIRTY_PAGE_POLL and LOGMGR_QUEUE. Ultimately, you would want to query the histogram using T-SQL so you can map the values to the corresponding collected results.
Histograms are clearly useful when you’re capturing data about “busy” events and need to know more about the data they’re returning, but if you want to use SSMS exclusively you’ll have to become familiar with some of the internal names Extended Events uses. Again, like event counters, histograms are in-memory structures, so their content is never written to an event file. Therefore, it is lost when SQL Server shuts down.
Pair matching
The pair matching target is another event data-handling, rather than storage, target that enables you to discard two sets of related event data from your results. The example that’s always used to demonstrate how this works is the data captured for the lock acquired and lock released events. If a lock is acquired but then subsequently released you’re probably not interested in storing information about that having happened, and the pair matching target will discard both of those events. What you’re more likely to be interested in are locks being acquired but not released by the same statement. If so, then using this target is appropriate.
Event tracing for Windows (ETW)
This is the last target that Extended Events in SQL Server 2012 has and it is at the very hardcore end of the feature’s capabilities. Using the ETW target enables SQL Server to integrate its event data with external Windows debugging software so that a complete picture of a system’s performance can be captured. It’s not something a SQL Server professional would typically do, but for those of you interested in the technology there are some excellent articles about it on the MSDN website.
?
Leave a Reply