SQL Server Plan Caching and Recompilation–Plan Cache

on January 31, 2013


About the SQL Server Plan Cache

The SQL Server plan cache is built on top of the caching infrastructure provided by the SQL OS. This provides objects called cache stores, which can be used to cache all kinds of objects. The plan cache contains several different cache stores used for different types of objects.

To see the contents of a few of the cache stores most relevant to this conversation, run the following T-SQL:

select name, entries_count, pages_kb
from sys.dm_os_memory_cache_counters
where [name] in (
'object plans'
, 'sql plans'
, 'extended stored procedures'
)
Example output when I ran the preceding on my laptop is as follows:

name                         entries_count pages_kbObject Plans
54             12312SQL Plans                  48            2904Extended
Stored Procedures 4                48
Each cache store contains a hash table that is used to provide efficient storage for the many plans that may reside in the plan cache at any time. The hash used is based on the plan handle. The hash provides buckets to store plans, and many plans can reside in any one bucket. SQL Server limits both the number of plans in any bucket and the total number of hash buckets. This is done to avoid issues with long lookup times when the cache has to store a large number of plans, which can easily happen on a busy server handling many different queries.

Find Performance Issues Caused by Long Lookup Times

To find performance issues caused by long lookup times, you can look into the contents of the DMV sys.dm_os_memory_cache_hash_tables, as shown in the following example. It is recommended that no bucket should contain more than 20 objects; and buckets exceeding 100 objects should be addressed.

select *
from sys.dm_os_memory_cache_hash_tables
where type in (
'cachestore_objcp'
, 'cachestore_sqlcp'
, 'cacchestore_phdr'
, 'cachestore_xproc'
)
Use the following DMV to look for heavily used buckets:

select bucketid, count(*) as entries_in_bucket
from sys.dm_exec_cached_plans
group by bucketid
order by 2 desc
You can look up the specific plans in that bucket using this query:

select *
from sys.dm_exec_cached_plans
where bucketid = 236

If the plans you find within the same bucket are all variations on the same query, then try to get better plan reuse through parameterization. If the queries are already quite different, and there is no commonality that would allow parameterization, then the solution is to rewrite the queries to be dramatically different, enabling them to be stored in emptier buckets.

Another approach is to query sys.dm_exec_query_stats, grouping on query_plan_hash to find queries with the same query plan hash using the T-SQL listed here:

select query_plan_hash,count(*) as occurrences
from sys.dm_exec_query_stats
group by query_plan_hash
having count(*) > 1

Examine Objects Stored in the SQL Server Plan Cache

Four different kinds of objects are stored in the plan cache. Although not all of them are of equal interest, each is briefly described here:

  • Algebrizer trees are the output of the algebrizer, although only the algebrizer trees for views, defaults, and constraints are cached.
  • Compiled plans are the objects you will be most interested in. This is where the query plan is cached.
  • Cursor execution contexts are used to track the execution state when a cursor is executing, and are similar to the next item.
  • Execution contexts track the context of an individual compiled plan.
The first DMV to look at in the procedure cache is sys.dm_exec_cached_plans. The following query gathers some statistics on the type of objects exposed through this DMV (note that this doesn’t include execution contexts, which are covered next):

select cacheobjtype, objtype, COUNT (*)
from sys.dm_exec_cached_plans
group by cacheobjtype, objtype
order by cacheobjtype, objtype
Running the preceding on my laptop resulted in the following output; your results will vary according to what was loaded into your procedure cache:

CACHEOBJTYPE    OBJTYPE    (NO COLUMN NAME)
Compiled Plan   Adhoc      43
Compiled Plan   Prepared   20
Compiled Plan   Proc       54
Extended Proc   Proc       4
Parse Tree      Check      2
Parse Tree      UsrTab     1
Parse Tree      View       64
To see the execution contexts, you must pass a specific plan handle to sys.dm_exec_cached_plans_dependent_objects. However, before doing that, you need to find a plan_handleto pass to this dynamic management function (DMF). To do that, run the following T-SQL:

-- Run this to empty the cache
-- WARNING !!! DO NOT TRY THIS ON A PRODUCTION SYSTEM !!!
dbcc freeproccache
Now see how many objects there are in the cache. There will always be a bunch of stuff here from the background activities that SQL is always running.

select cacheobjtype, objtype, COUNT (*)
from sys.dm_exec_cached_plans
group by cacheobjtype, objtype
order by cacheobjtype, objtype
The output of the query will look similar to this:

CACHEOBJTYPE     OBJTYPE    (NO COLUMN NAME)
Compiled Plan    Adhoc      5
Compiled Plan    Prepared   1
Compiled Plan    Proc       11
Extended Proc    Proc       1
Parse Tree       View       10
Run the following code in the AdventureWorks2012 database, from another connection:

select lastname, COUNT (*)
from Person.Person_test
group by lastname
order by 2 desc
The output of the prior query is not of interest, so it’s not shown here. The following query goes back and reexamines the cache:

-- Check that we got additional objects into the cache
select cacheobjtype, objtype, COUNT (*)
from sys.dm_exec_cached_plans
group by cacheobjtype, objtype
order by cacheobjtype, objtype
The output of the query will look similar to this:

CACHEOBJTYPE    OBJTYPE    (NO COLUMN NAME)
Compiled Plan   Adhoc      9
Compiled Plan   Prepared   2
Compiled Plan   Proc       14
Extended Proc   Proc       2
Parse Tree      View       13
At this point you can see that there are four more ad hoc compiled plans, and a number of other new cached objects. The objects you are interested in here are the ad hoc plans.
Run the following T-SQL to get the SQL text and the plan handle for the T-SQL query you ran against the AdventureWorks2012 database:

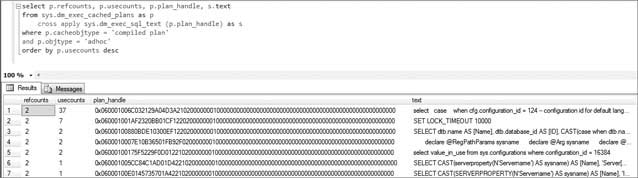
select p.refcounts, p.usecounts, p.plan_handle, s.text
from sys.dm_exec_cached_plans as p
    cross apply sys.dm_exec_sql_text (p.plan_handle) as s
where p.cacheobjtype = 'compiled plan'
and p.objtype = 'adhoc'
order by p.usecounts desc
This should provide something similar to the results shown in Figure 1.
C 05f 004
Figure 1.
To see the execution context, take the plan_handle that you got from the preceding results and plug it into the DMF sys.dm_exec_cached_plan_dependent_objects, as shown in the following example:

select *
from sys.dm_exec_cached_plan_dependent_objects
(0x06000F005163130CB880EE0D000000000000000000000000)
The preceding code returned the following results:

USECOUNTS MEMORY_OBJECT_ADDRESS CACHEOBJTYPE
1         0x0DF8A038            Executable Plan

Examine SQL Server Plan Attributes

Another interesting thing you can examine are the attributes of the plan. These are found in the DMF sys.dm_exec_plan_attributes (plan_handle) Note that you need to pass the DMF a plan handle, and then you will get the attributes for that plan:

select *
from sys.dm_exec_plan_attributes
(0x06000F00C080471DB8E06914000000000000000000000000)
The preceding query outputs a list of 28 attributes, a select few of which are shown here:

ATTRIBUTE      VALUE                                           IS_CACHE_KEY
set_options    135419                                          1
objectid       491225280                                       1
dbid           15                                              1
language_id    0                                               1
date_format    1                                               1
date_first     7                                               1
compat_level   100                                             1
sql_handle 0x02000000C080471DB475BDA81DA97B1C6F2EEA51417711E8  0
The sql_handle in these results can then be used in a call to the DMF sys.dm_exec_sql_ text (sql_handle) to see the SQL that was being run.

Monitoring Compilation and Recompilation

Compilation and recompilation are pretty much the same thing, just triggered at slightly different times. When SQL Server decides that an existing plan is no longer valid, which is usually due to a schema change, statistics changes, or some other event, it will re-compile the plan. This happens only when someone tries to run the query. If they try to run the query when no one else is using the plan, it is a compile event. If this happens when someone else is using a copy of the plan, it is a recompile event.
You can monitor the amount of compilation/recompilation that’s occurring by observing the PerfMon Object SQL Server: SQL Statistics and then looking at the following two counters: SQL compilations/sec and SQL recompilations/sec.

Related Posts

Leave a Reply