Events can be viewed in the Incident Manager. Most events that you address are cleared automatically from this page. What remains are events that do not automatically clear or ones that have not received a response from an administrator. Some events do not clear automatically because Cloud Control has no way of verifying whether the underlying problem has been addressed. For these alerts, a Clear button is available in the event detail section of the Incident Manager; see Figure 1.
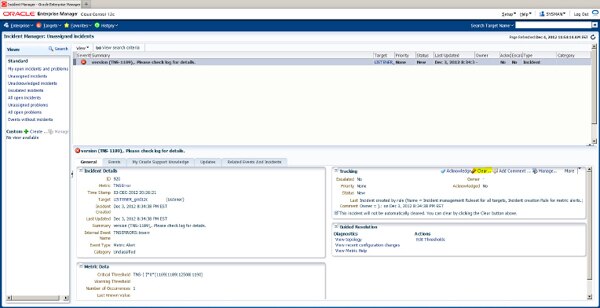
FIGURE 1. Incident Manager: Clear Event button
For those events that you have not yet resolved, some are legitimate alerts that require your attention. For these events you must remedy the underlying condition. Other events are false alarms that fire, sometimes repeatedly, due to inappropriate Critical and Warning metric threshold values. Repeated alerts for the same metric occur when the metric’s value cycles across Critical and Warning thresholds within the collection interval, which is typically five minutes. Repeated Warning, Critical, and Clear event notifications ensue, sometimes for hours on end. These false notifications annoy administrators and can easily damage the “monitoring credibility” of a Cloud Control site. This type of rapid-fire alerting wastes OMS resources and can cause a backlog in notification delivery or metric data uploads. When this happens, relax the threshold tolerances for the offending metric. Increase the difference between the Warning and Critical threshold values, use a null value for one or the other severity, raise or lower metric values (as appropriate) for both severities, or use a combination of these methods. Adjusting thresholds is the standard way to keep an event from constantly alerting, and is the appropriate response for these situations.
OMR Database Alert Log Errors
Alerts that deserve special mention for a Cloud Control system are alert log errors for the Management Repository database. You should promptly investigate both Warning and Critical errors. For example, the default Warning threshold for the Database Instance metric called Generic Alert Log Error includes serious errors such as ORA-600 (internal errors for Oracle program exceptions) and ORA-7445 (OS exceptions that generate a trace or core file). Again, My Oracle Support is the principal source for researching such errors and for obtaining patches and workarounds.
Reorganizing Tables and Indexes
As with any Oracle database, the Repository database requires periodic upkeep of its tables and indexes. Every month you should pinpoint those tables and indexes that have undergone high inserts and deletes, causing their allocated size to balloon and actual size to become a fraction thereof. You must then shut down the Management Services and rebuild these tables and related indexes offline. Rebuilding an object recreates its physical structure, reduces its allocated size to its actual need, and resets its high-water mark. Rebuilding all the OMR database tables and indexes is overkill and places an unnecessary burden on the Repository database. Only those tables that experience a high level of inserts and deletes need this special attention.
Cloud Control Metrics
Cloud Control offers many useful built-in metrics for monitoring performance. Many metrics can be evaluated with thresholds, but others are also available that are maintained strictly for statistical purposes. All the Management Services and Repository metrics can be viewed from the All Metrics page, which can be accessed from the OMS and Repository menu; see Figure 2.
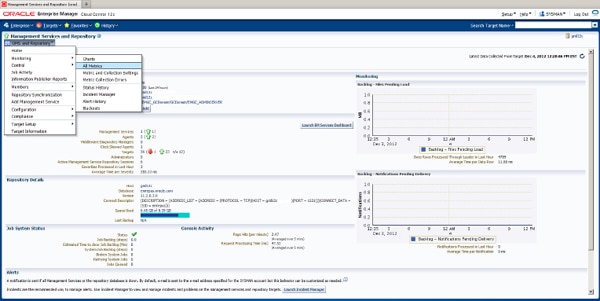
FIGURE 2. Management Services and Repository: Access to All Metrics
As you can see on the All Metrics page (Figure 3), you cannot set thresholds for many of the metrics. However, historical metric values are available for all the listed metrics on this page by drilling down as shown here by clicking on the Total Throughput Across Collection Workers metric.
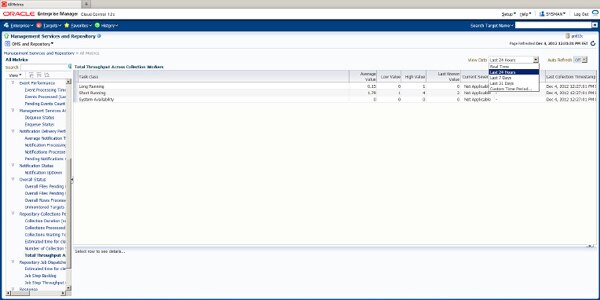
FIGURE 3. Management Services and Repository: All Metrics – drill down
As you can see, you can select historical data for different time periods, 24 hours, 7 days, 31 days, and custom ranges. To get a longer-term view of metric values, choose “Last 31 days,” or step back even further by selecting Custom, which allows you to view data as far back as the retention policy provides. This page is where we collect our initial base line metrics for later comparison, review, and research.
Average weekly values for key metrics on OMS and Repository hosts are good indicators of Cloud Control resource consumption. Most host metrics of interest are regular metrics, such as Memory Utilization (%), that appear on the Metric and Collection Settings page. You will also find configuration and resource-related properties on the OMS/OMR target pages, such as the number of nodes, number and speed of CPUs, amount of RAM, and the number, speed, and configuration of network adapters. You should keep track of such properties over the long term because they can play a large role in Cloud Control performance. It is easy to overlook the tracking of host configuration changes alongside other metrics. Without such records whose datelines can be compared against other metric values, you may be left with unexplained performance changes.
It is important to periodically collect new key metrics and compare them to the original baselines. These trends help you gauge your site’s relative state of health compared to the earlier period and provide a basis and direction for tuning. Potential problem errors are often identified as “bottlenecks.”
The primary causes of Cloud Control bottlenecks are overlooked housekeeping or failure to meet the deployment resource requirements. However, if you’ve met the requirements and have been diligent about carrying out the maintenance tasks discussed in this chapter, then you may need to look elsewhere for the culprit. Likely causes include incorrectly configured resource (hardware or software) and hardware resource constraints. One example is high CPU consumption. High CPU utilization can occur on both OMS and OMS systems, but is usually a problem on the Repository nodes. OMR systems consume more CPU than the OMS because the Repository database performs most of the heavy hitting in Cloud Control. While the OMS does its own share of processing by uploading Agent files to the Repository, the other major OMS function, rendering the Console, is more of a memory-draining than a CPU-intensive operation. By contrast, the Repository must use processing power to continuously load and roll up Agent data and execute many other statistical computations. The Repository Operations tab (Figure 4), reached from the Management Services and Repository home page, reveals the number of these processing tasks.

FIGURE 4. Management Services and Repository: Repository Operations
The Repository Operations tab will help identify the task, or tasks, that may be consuming a disproportionate amount of CPU. With this information you can make further decisions with respect to resource configuration and allocation. As applications go, Cloud Control is a significant consumer of resources. However, in contrast to most applications, Cloud Control does provide you with the tools to investigate and identify performance issues.
Leave a Reply